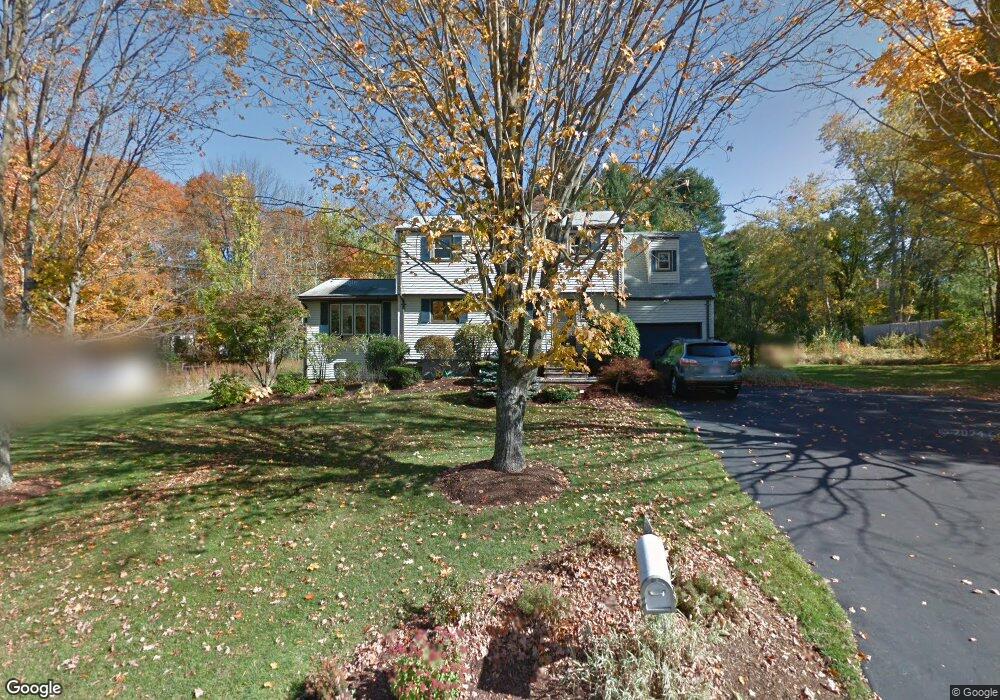
5 Elysian Dr Andover, MA 01810
Shawsheen Heights NeighborhoodEstimated Value: $878,000 - $1,095,000
4
Beds
2
Baths
2,501
Sq Ft
$387/Sq Ft
Est. Value
About This Home
This home is located at 5 Elysian Dr, Andover, MA 01810 and is currently estimated at $967,034, approximately $386 per square foot. 5 Elysian Dr is a home located in Essex County with nearby schools including West Elementary School, Doherty Middle School, and Andover High School.
Ownership History
Date
Name
Owned For
Owner Type
Purchase Details
Closed on
Jul 29, 2024
Sold by
Rutfild Rt and Rutfield
Bought by
Craig S Rutfield T S and Craig Ruthfield
Current Estimated Value
Purchase Details
Closed on
Nov 29, 2011
Sold by
Rutfield Craig S and Rutfield Sharon B
Bought by
Rutfield Rt and Rutfield
Purchase Details
Closed on
Nov 26, 1993
Sold by
Yaghmoorian Robert M
Bought by
Rutfeld Craig S
Create a Home Valuation Report for This Property
The Home Valuation Report is an in-depth analysis detailing your home's value as well as a comparison with similar homes in the area
Home Values in the Area
Average Home Value in this Area
Purchase History
| Date | Buyer | Sale Price | Title Company |
|---|---|---|---|
| Craig S Rutfield T S | -- | None Available | |
| Craig S Rutfield T S | -- | None Available | |
| Rutfield Rt | -- | -- | |
| Rutfeld Craig S | $194,000 | -- | |
| Rutfield Rt | -- | -- | |
| Rutfeld Craig S | $194,000 | -- |
Source: Public Records
Mortgage History
| Date | Status | Borrower | Loan Amount |
|---|---|---|---|
| Previous Owner | Rutfeld Craig S | $127,000 | |
| Previous Owner | Rutfeld Craig S | $17,100 | |
| Previous Owner | Rutfeld Craig S | $20,000 |
Source: Public Records
Tax History
| Year | Tax Paid | Tax Assessment Tax Assessment Total Assessment is a certain percentage of the fair market value that is determined by local assessors to be the total taxable value of land and additions on the property. | Land | Improvement |
|---|---|---|---|---|
| 2024 | $10,524 | $817,100 | $464,000 | $353,100 |
| 2023 | $10,058 | $736,300 | $417,800 | $318,500 |
| 2022 | $9,442 | $646,700 | $363,400 | $283,300 |
| 2021 | $9,029 | $590,500 | $330,400 | $260,100 |
| 2020 | $8,658 | $576,800 | $322,400 | $254,400 |
| 2019 | $8,536 | $559,000 | $312,900 | $246,100 |
| 2018 | $8,242 | $527,000 | $301,000 | $226,000 |
| 2017 | $7,901 | $520,500 | $295,000 | $225,500 |
| 2016 | $7,736 | $522,000 | $295,000 | $227,000 |
| 2015 | $7,466 | $498,700 | $283,500 | $215,200 |
Source: Public Records
Map
Nearby Homes
- 181 High St Unit 1
- 1 Longwood Dr Unit 105
- 35 Peters St
- 15 Alcott Way
- 2 Kingston St Unit 2
- 124 Quail Run Rd
- 136 Quail Run Rd
- 50C Washington Park Dr Unit 10
- 28 Stirling St
- 1 Sweeney Ct
- 2 Powder Mill Square Unit 2B
- 16 Balmoral St Unit 214
- 5 Lewis St
- 42 York St
- Lot 7 Weeping Willow Dr
- 33 Chestnut St Unit 2
- 70 Farrwood Ave Unit 7
- 66 Fernview Ave Unit 9
- 96 N Main St Unit 3
- 75 Edgelawn Ave Unit 1
Your Personal Tour Guide
Ask me questions while you tour the home.