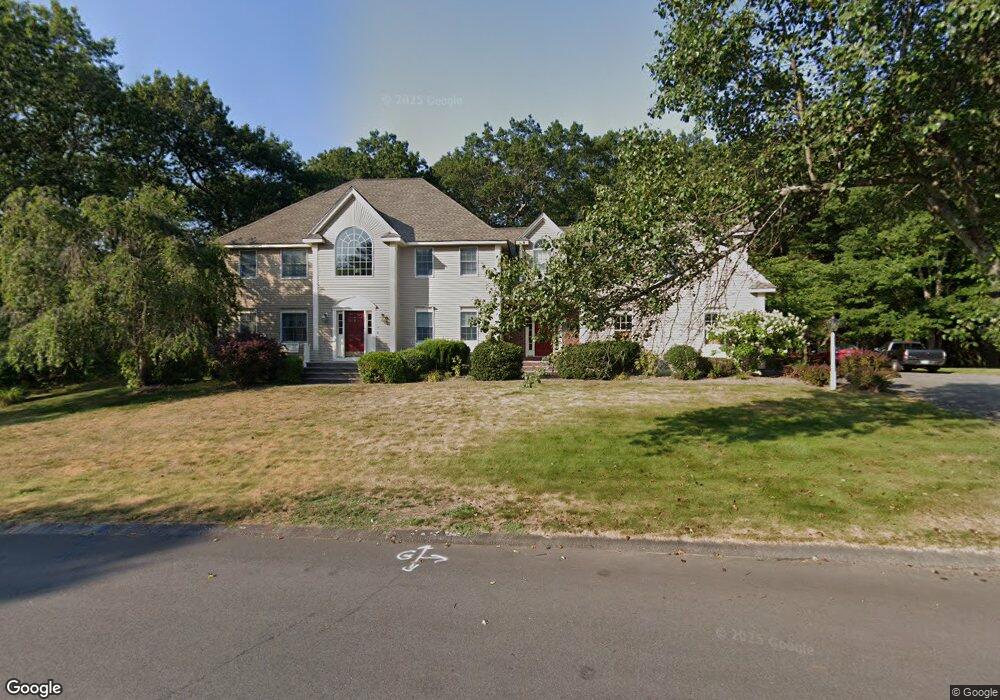
5 Erin Way Middleton, MA 01949
Estimated Value: $1,288,000 - $1,568,000
4
Beds
3
Baths
3,697
Sq Ft
$383/Sq Ft
Est. Value
About This Home
This home is located at 5 Erin Way, Middleton, MA 01949 and is currently estimated at $1,416,128, approximately $383 per square foot. 5 Erin Way is a home located in Essex County with nearby schools including Howe-Manning Elementary School, Fuller Meadow Elementary School, and Masconomet Regional Middle School.
Ownership History
Date
Name
Owned For
Owner Type
Purchase Details
Closed on
Apr 8, 2008
Sold by
Famolare Cynthia A and Famolare Joseph
Bought by
Dangelo Joseph L
Current Estimated Value
Purchase Details
Closed on
Jun 16, 1994
Sold by
Fieldstone Place Corp
Bought by
Dangelo Joseph L and Dangelo Kathleen E
Create a Home Valuation Report for This Property
The Home Valuation Report is an in-depth analysis detailing your home's value as well as a comparison with similar homes in the area
Home Values in the Area
Average Home Value in this Area
Purchase History
| Date | Buyer | Sale Price | Title Company |
|---|---|---|---|
| Dangelo Joseph L | -- | -- | |
| Dangelo Joseph L | -- | -- | |
| Dangelo Joseph L | $125,000 | -- | |
| Dangelo Joseph L | $125,000 | -- |
Source: Public Records
Mortgage History
| Date | Status | Borrower | Loan Amount |
|---|---|---|---|
| Open | Dangelo Joseph L | $568,000 | |
| Previous Owner | Dangelo Joseph L | $95,000 | |
| Previous Owner | Dangelo Joseph L | $125,000 |
Source: Public Records
Tax History Compared to Growth
Tax History
| Year | Tax Paid | Tax Assessment Tax Assessment Total Assessment is a certain percentage of the fair market value that is determined by local assessors to be the total taxable value of land and additions on the property. | Land | Improvement |
|---|---|---|---|---|
| 2025 | $16,245 | $1,366,300 | $624,000 | $742,300 |
| 2024 | $15,961 | $1,353,800 | $622,000 | $731,800 |
| 2023 | $15,076 | $1,171,400 | $622,000 | $549,400 |
| 2022 | $12,133 | $915,700 | $417,200 | $498,500 |
| 2021 | $11,887 | $866,400 | $388,000 | $478,400 |
| 2020 | $11,411 | $837,800 | $354,000 | $483,800 |
| 2019 | $10,673 | $779,600 | $306,000 | $473,600 |
| 2018 | $10,598 | $759,200 | $306,000 | $453,200 |
| 2017 | $10,549 | $756,200 | $310,000 | $446,200 |
| 2016 | $10,601 | $763,200 | $324,000 | $439,200 |
| 2015 | $10,069 | $730,700 | $292,000 | $438,700 |
Source: Public Records
Map
Nearby Homes