E
Seller's Agent in 2025
Erica Gemme
Coldwell Banker Realty - Worcester
1 in this area
18 Total Sales
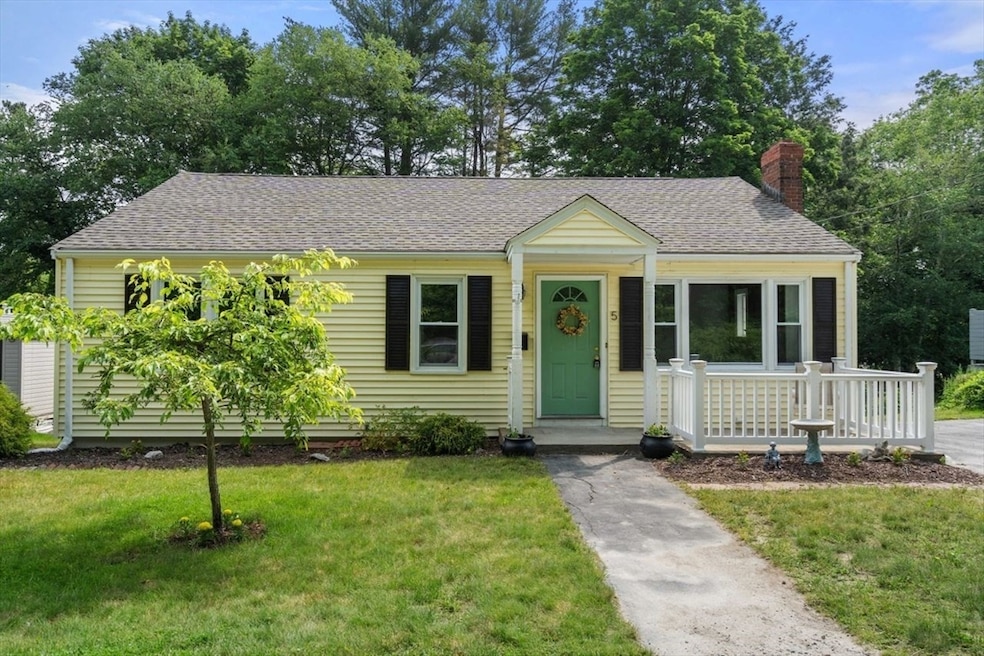
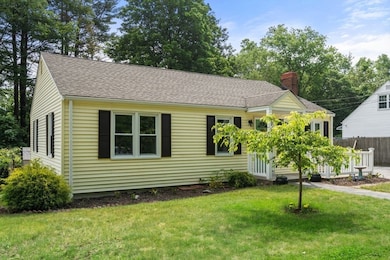
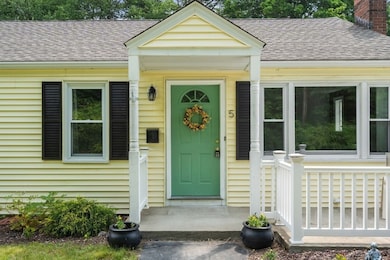
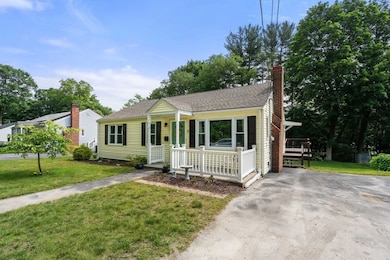
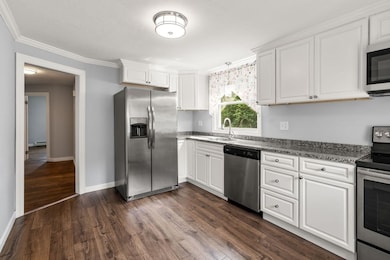
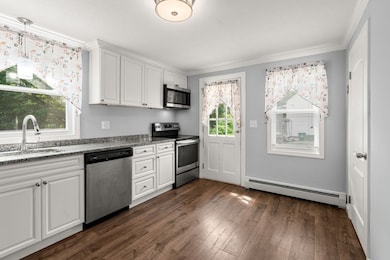
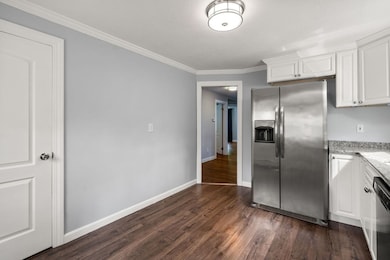
Move-In Ready! This charming ranch-style house is situated in the desirable west side of Worcester. Featuring a functional layout, this home offers convenient one level living with modern amenities. Cozy bedrooms provide a peaceful retreat, and the kitchen is equipped with stainless steel appliances, white cabinets, granite countertops, and ample storage space. The living room has a fireplace and large picture window letting in plenty of natural light, creating a bright and inviting atmosphere. Hardwood floors and new windows throughout add to the home's charm. The basement includes washer and dryer hookups and two extra finished rooms with electric baseboard heat, providing additional space for your needs. Outside, enjoy the spacious deck and back-yard offering plenty of space for outdoor activities and relaxation. Don't miss the opportunity to own this lovely home in a prime location!
Last Agent to Sell the Property
Coldwell Banker Realty - Worcester Listed on: 06/10/2025

| Date | Type | Sale Price | Title Company |
|---|---|---|---|
| Quit Claim Deed | $423,000 | -- | |
| Quit Claim Deed | $423,000 | -- | |
| Quit Claim Deed | -- | None Available | |
| Quit Claim Deed | -- | None Available | |
| Quit Claim Deed | -- | None Available | |
| Quit Claim Deed | -- | None Available | |
| Quit Claim Deed | -- | None Available | |
| Quit Claim Deed | -- | None Available | |
| Quit Claim Deed | $225,000 | -- | |
| Quit Claim Deed | $225,000 | -- | |
| Foreclosure Deed | $108,000 | -- | |
| Foreclosure Deed | $108,000 | -- | |
| Land Court Massachusetts | -- | -- | |
| Land Court Massachusetts | -- | -- | |
| Deed | $201,500 | -- | |
| Deed | $201,500 | -- | |
| Deed | $89,901 | -- | |
| Foreclosure Deed | $71,056 | -- | |
| Quit Claim Deed | $225,000 | -- | |
| Foreclosure Deed | $108,000 | -- | |
| Land Court Massachusetts | -- | -- | |
| Deed | $201,500 | -- | |
| Deed | $89,901 | -- | |
| Foreclosure Deed | $71,056 | -- |
| Date | Status | Loan Amount | Loan Type |
|---|---|---|---|
| Open | $338,400 | New Conventional | |
| Closed | $338,400 | New Conventional | |
| Previous Owner | $167,475 | Purchase Money Mortgage |
| Date | Event | Price | List to Sale | Price per Sq Ft |
|---|---|---|---|---|
| 07/15/2025 07/15/25 | Sold | $423,000 | +6.0% | $398 / Sq Ft |
| 06/13/2025 06/13/25 | Pending | -- | -- | -- |
| 06/10/2025 06/10/25 | For Sale | $399,000 | -- | $375 / Sq Ft |
| Year | Tax Paid | Tax Assessment Tax Assessment Total Assessment is a certain percentage of the fair market value that is determined by local assessors to be the total taxable value of land and additions on the property. | Land | Improvement |
|---|---|---|---|---|
| 2025 | $4,245 | $321,800 | $118,800 | $203,000 |
| 2024 | $4,192 | $304,900 | $118,800 | $186,100 |
| 2023 | $4,189 | $292,100 | $103,300 | $188,800 |
| 2022 | $3,707 | $243,700 | $82,700 | $161,000 |
| 2021 | $3,552 | $218,200 | $66,200 | $152,000 |
| 2020 | $3,422 | $201,300 | $66,100 | $135,200 |
| 2019 | $3,253 | $180,700 | $59,600 | $121,100 |
| 2018 | $3,171 | $167,700 | $59,600 | $108,100 |
| 2017 | $3,196 | $166,300 | $59,600 | $106,700 |
| 2016 | $3,092 | $150,000 | $44,000 | $106,000 |
| 2015 | $3,011 | $150,000 | $44,000 | $106,000 |
| 2014 | $2,931 | $150,000 | $44,000 | $106,000 |
E
Seller's Agent in 2025
Erica Gemme
Coldwell Banker Realty - Worcester
1 in this area
18 Total Sales
E
Buyer's Agent in 2025
Ellie Cacollari
Real Broker MA, LLC
(978) 660-7410
2 in this area
18 Total Sales
Source: MLS Property Information Network (MLS PIN)
MLS Number: 73388773
APN: WORC-000048-000026-000024
Disclaimer: Certain information contained herein is derived from information provided by parties other than Homes.com. All information provided is deemed reliable, but is not guaranteed to be accurate and should be independently verified.
![]() The property listing data and information, or the Images, set forth herein were provided to MLS Property Information Network, Inc. from third party sources, including sellers, lessors and public records, and were compiled by MLS Property Information Network, Inc. The property listing data and information, and the Images, are for the personal, non-commercial use of consumers having a good faith interest in purchasing or leasing listed properties of the type displayed to them and may not be used for any purpose other than to identify prospective properties which such consumers may have a good faith interest in purchasing or leasing. MLS Property Information Network, Inc. and its subscribers disclaim any and all representations and warranties as to the accuracy of the property listing data and information, or as to the accuracy of any of the Images, set forth herein.
The property listing data and information, or the Images, set forth herein were provided to MLS Property Information Network, Inc. from third party sources, including sellers, lessors and public records, and were compiled by MLS Property Information Network, Inc. The property listing data and information, and the Images, are for the personal, non-commercial use of consumers having a good faith interest in purchasing or leasing listed properties of the type displayed to them and may not be used for any purpose other than to identify prospective properties which such consumers may have a good faith interest in purchasing or leasing. MLS Property Information Network, Inc. and its subscribers disclaim any and all representations and warranties as to the accuracy of the property listing data and information, or as to the accuracy of any of the Images, set forth herein.
Ask me questions while you tour the home.