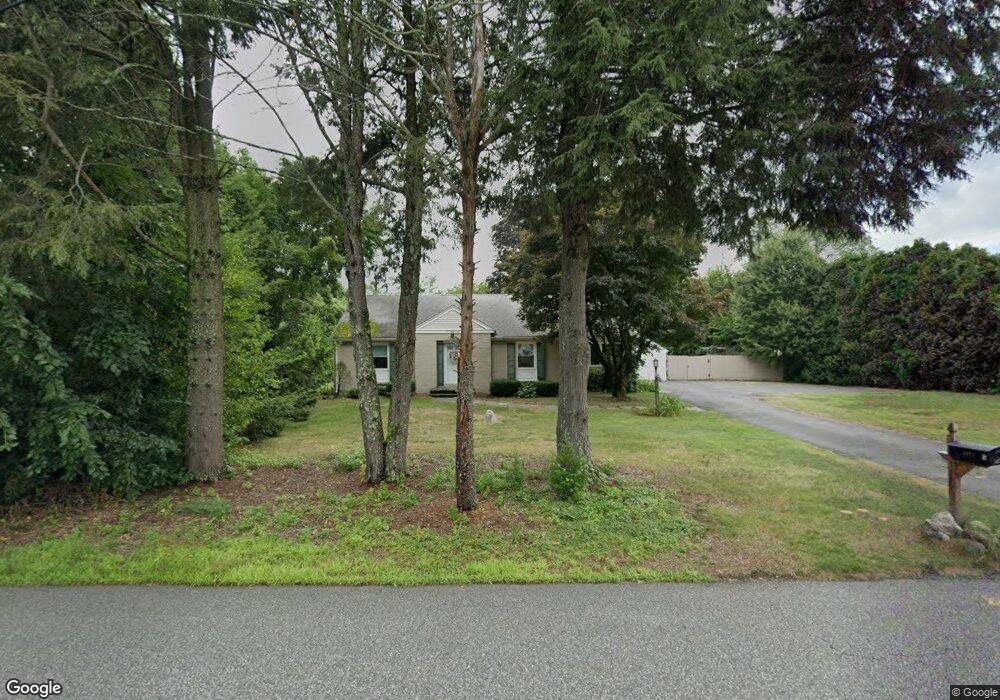
5 Fairview Rd Wilbraham, MA 01095
Estimated Value: $446,416 - $515,000
3
Beds
2
Baths
1,718
Sq Ft
$285/Sq Ft
Est. Value
About This Home
This home is located at 5 Fairview Rd, Wilbraham, MA 01095 and is currently estimated at $490,354, approximately $285 per square foot. 5 Fairview Rd is a home located in Hampden County with nearby schools including Minnechaug Regional High School, Pioneer Valley Montessori School, and Wilbraham & Monson Academy.
Ownership History
Date
Name
Owned For
Owner Type
Purchase Details
Closed on
May 16, 2012
Sold by
Anti Laurie J and Mercier Michael D
Bought by
Anti Laurie J
Current Estimated Value
Purchase Details
Closed on
Jun 30, 2003
Sold by
Deforest James L and Deforest Sharon L
Bought by
Anti Laurie J and Mercier Michael D
Home Financials for this Owner
Home Financials are based on the most recent Mortgage that was taken out on this home.
Original Mortgage
$225,000
Interest Rate
5.53%
Mortgage Type
Purchase Money Mortgage
Create a Home Valuation Report for This Property
The Home Valuation Report is an in-depth analysis detailing your home's value as well as a comparison with similar homes in the area
Home Values in the Area
Average Home Value in this Area
Purchase History
| Date | Buyer | Sale Price | Title Company |
|---|---|---|---|
| Anti Laurie J | -- | -- | |
| Anti Laurie J | $250,000 | -- |
Source: Public Records
Mortgage History
| Date | Status | Borrower | Loan Amount |
|---|---|---|---|
| Previous Owner | Anti Laurie J | $225,000 |
Source: Public Records
Tax History
| Year | Tax Paid | Tax Assessment Tax Assessment Total Assessment is a certain percentage of the fair market value that is determined by local assessors to be the total taxable value of land and additions on the property. | Land | Improvement |
|---|---|---|---|---|
| 2025 | $7,769 | $434,500 | $99,500 | $335,000 |
| 2024 | $7,637 | $412,800 | $99,500 | $313,300 |
| 2023 | $6,874 | $387,800 | $99,500 | $288,300 |
| 2022 | $6,874 | $335,500 | $99,500 | $236,000 |
| 2021 | $6,479 | $282,200 | $106,700 | $175,500 |
| 2020 | $6,316 | $282,200 | $106,700 | $175,500 |
| 2019 | $6,152 | $282,200 | $106,700 | $175,500 |
| 2018 | $5,814 | $256,800 | $106,700 | $150,100 |
| 2017 | $5,650 | $256,800 | $106,700 | $150,100 |
| 2016 | $5,551 | $257,000 | $118,600 | $138,400 |
| 2015 | $5,366 | $257,000 | $118,600 | $138,400 |
Source: Public Records
Map
Nearby Homes
- 6 Katie St
- 24 Mcintosh Dr
- 5 Northwood Dr
- 230V Burleigh Rd
- 208 Tamarack Dr
- 8 Patriot Ridge Ln
- 59 Baldwin Dr
- 25 Angelica Dr
- 85 Baldwin Dr
- 6 Brooklawn Rd
- 6 Hilltop Park
- 107 Baldwin Dr
- 301 Tinkham Rd
- 15 Pine Acre Rd
- 20 Old Orchard Rd
- 16 Deerfoot Dr
- 2306 Wilbraham Rd
- 17 Jeanne Marie St
- 474 Mountain Rd
- 46 Holland Dr
Your Personal Tour Guide
Ask me questions while you tour the home.