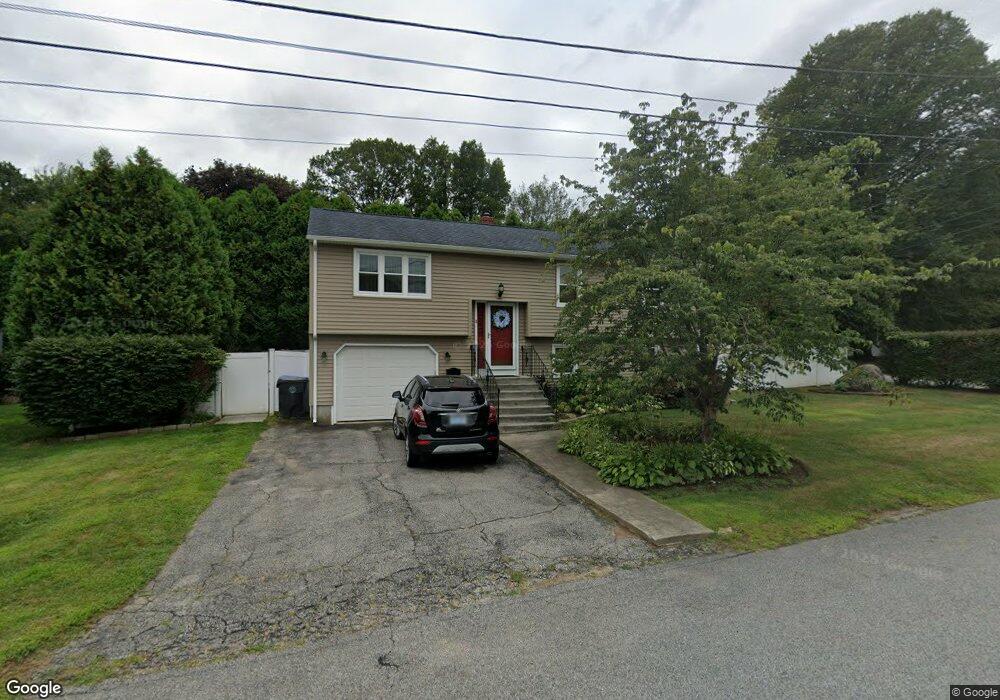
5 Faxon St West Warwick, RI 02893
Centreville NeighborhoodEstimated Value: $421,701 - $462,000
2
Beds
2
Baths
1,776
Sq Ft
$250/Sq Ft
Est. Value
About This Home
This home is located at 5 Faxon St, West Warwick, RI 02893 and is currently estimated at $444,175, approximately $250 per square foot. 5 Faxon St is a home located in Kent County with nearby schools including West Warwick High School.
Ownership History
Date
Name
Owned For
Owner Type
Purchase Details
Closed on
Jan 25, 2021
Sold by
Rampone Anna R
Bought by
Marciano Anna R
Current Estimated Value
Home Financials for this Owner
Home Financials are based on the most recent Mortgage that was taken out on this home.
Original Mortgage
$180,000
Outstanding Balance
$144,652
Interest Rate
2.6%
Mortgage Type
New Conventional
Estimated Equity
$299,523
Purchase Details
Closed on
Jul 28, 2008
Sold by
Jaeger Richard K and Jaeger Cindy
Bought by
Rampone Anna R
Home Financials for this Owner
Home Financials are based on the most recent Mortgage that was taken out on this home.
Original Mortgage
$164,900
Interest Rate
6.35%
Mortgage Type
Purchase Money Mortgage
Purchase Details
Closed on
Dec 6, 1988
Sold by
Fortin Gregory
Bought by
Jaeger Richard
Create a Home Valuation Report for This Property
The Home Valuation Report is an in-depth analysis detailing your home's value as well as a comparison with similar homes in the area
Home Values in the Area
Average Home Value in this Area
Purchase History
| Date | Buyer | Sale Price | Title Company |
|---|---|---|---|
| Marciano Anna R | -- | None Available | |
| Marciano Anna R | -- | None Available | |
| Rampone Anna R | $224,900 | -- | |
| Jaeger Richard | $126,000 | -- |
Source: Public Records
Mortgage History
| Date | Status | Borrower | Loan Amount |
|---|---|---|---|
| Open | Marciano Anna R | $180,000 | |
| Previous Owner | Jaeger Richard | $164,900 | |
| Previous Owner | Jaeger Richard | $125,000 | |
| Previous Owner | Jaeger Richard | $10,000 | |
| Previous Owner | Jaeger Richard | $90,000 |
Source: Public Records
Tax History Compared to Growth
Tax History
| Year | Tax Paid | Tax Assessment Tax Assessment Total Assessment is a certain percentage of the fair market value that is determined by local assessors to be the total taxable value of land and additions on the property. | Land | Improvement |
|---|---|---|---|---|
| 2025 | $5,343 | $373,900 | $110,400 | $263,500 |
| 2024 | $5,231 | $279,900 | $73,900 | $206,000 |
| 2023 | $5,128 | $279,900 | $73,900 | $206,000 |
| 2022 | $5,049 | $279,900 | $73,900 | $206,000 |
| 2021 | $5,111 | $222,200 | $61,600 | $160,600 |
| 2020 | $5,111 | $222,200 | $61,600 | $160,600 |
| 2019 | $6,515 | $222,200 | $61,600 | $160,600 |
| 2018 | $4,619 | $174,900 | $64,100 | $110,800 |
| 2017 | $4,602 | $174,900 | $64,100 | $110,800 |
| 2016 | $4,519 | $174,900 | $64,100 | $110,800 |
| 2015 | $4,379 | $168,700 | $64,100 | $104,600 |
| 2014 | $1,071 | $168,700 | $64,100 | $104,600 |
Source: Public Records
Map
Nearby Homes
- 16 Ontario St
- 34 Buckley Ave
- 64 Lockwood St
- 52 Glen Dr
- 38 New London Ave
- 3 June Ct
- 46 Trellis Dr
- 170 Cowesett Ave
- 177 Cowesett Ave
- 1 Leona Ct
- 3 Leona Ct
- 94 Cowesett Ave Unit 8
- 1199 Centerville Rd
- 33 Judy Terrace
- 101 Quaker Ln
- 1209 Centerville Rd Unit 2
- 25 School St
- 45 Judy Terrace
- 12 Earl St
- 2 Teresa Ann Crossing