Estimated Value: $807,000 - $861,000
4
Beds
2
Baths
1,816
Sq Ft
$462/Sq Ft
Est. Value
About This Home
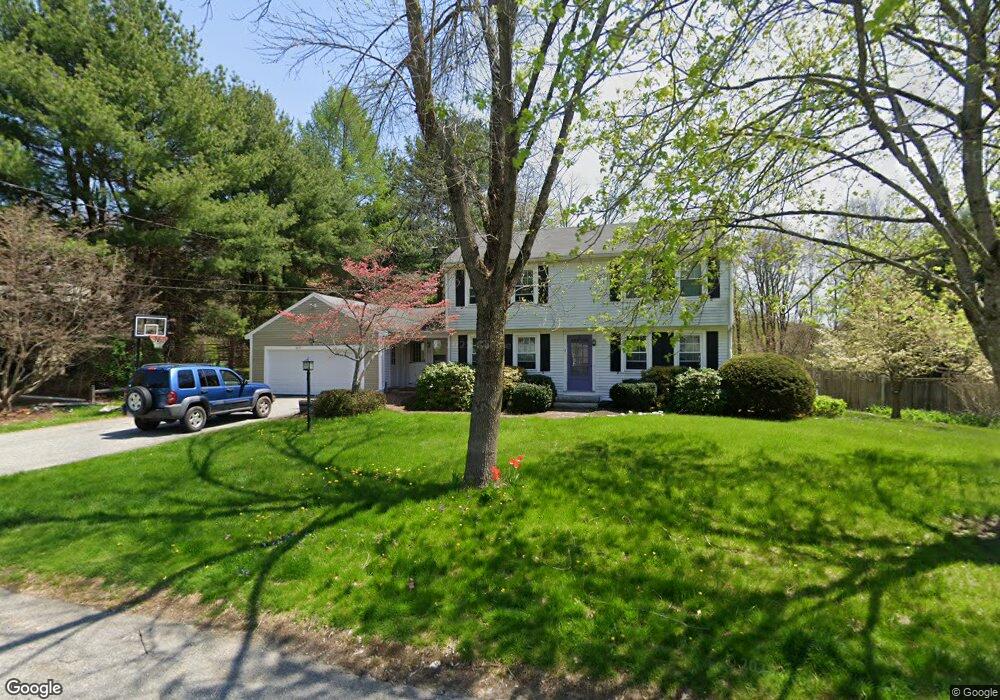
This home is located at 5 Foster St, Acton, MA 01720 and is currently estimated at $839,676, approximately $462 per square foot. 5 Foster St is a home located in Middlesex County with nearby schools including Acton-Boxborough Regional High School and Maynard Knowledge Beginnings.
Ownership History
Date
Name
Owned For
Owner Type
Purchase Details
Closed on
Jul 9, 2002
Sold by
Hb Dev Corp
Bought by
Elgeziry Mohamed A
Current Estimated Value
Home Financials for this Owner
Home Financials are based on the most recent Mortgage that was taken out on this home.
Original Mortgage
$553,600
Outstanding Balance
$236,512
Interest Rate
6.82%
Mortgage Type
Purchase Money Mortgage
Estimated Equity
$603,164
Purchase Details
Closed on
Nov 1, 2001
Sold by
Meehan Gail B and Meehan Robert E
Bought by
Landry Robert B and Landry Katherine
Home Financials for this Owner
Home Financials are based on the most recent Mortgage that was taken out on this home.
Original Mortgage
$275,000
Interest Rate
6.82%
Mortgage Type
Purchase Money Mortgage
Create a Home Valuation Report for This Property
The Home Valuation Report is an in-depth analysis detailing your home's value as well as a comparison with similar homes in the area
Home Values in the Area
Average Home Value in this Area
Purchase History
| Date | Buyer | Sale Price | Title Company |
|---|---|---|---|
| Elgeziry Mohamed A | $692,000 | -- | |
| Landry Robert B | $398,000 | -- |
Source: Public Records
Mortgage History
| Date | Status | Borrower | Loan Amount |
|---|---|---|---|
| Open | Elgeziry Mohamed A | $553,600 | |
| Previous Owner | Landry Robert B | $275,000 |
Source: Public Records
Tax History
| Year | Tax Paid | Tax Assessment Tax Assessment Total Assessment is a certain percentage of the fair market value that is determined by local assessors to be the total taxable value of land and additions on the property. | Land | Improvement |
|---|---|---|---|---|
| 2025 | $12,144 | $708,100 | $315,900 | $392,200 |
| 2024 | $11,389 | $683,200 | $315,900 | $367,300 |
| 2023 | $11,091 | $631,600 | $287,300 | $344,300 |
| 2022 | $10,513 | $540,500 | $249,800 | $290,700 |
| 2021 | $10,246 | $506,500 | $231,100 | $275,400 |
| 2020 | $9,822 | $510,500 | $231,100 | $279,400 |
| 2019 | $9,282 | $479,200 | $231,100 | $248,100 |
| 2018 | $9,138 | $471,500 | $231,100 | $240,400 |
| 2017 | $8,912 | $467,600 | $231,100 | $236,500 |
| 2016 | $8,767 | $455,900 | $231,100 | $224,800 |
| 2015 | $8,708 | $457,100 | $231,100 | $226,000 |
| 2014 | $8,467 | $435,300 | $231,100 | $204,200 |
Source: Public Records
Map
Nearby Homes
- 303 School St
- 60 Lawsbrook Rd
- 65 Summit St
- 245 Oak Hill Cir
- 27 Forest Rd
- 31 Drummer Rd Unit 31
- 132 Parker St Unit G5
- 3 Drummer Rd Unit B3
- 37 Water St
- 27 Water St
- 70 River St
- 66 Old Stow Rd
- 1 Bayberry Rd
- 1828 Main St
- 46 Taylor Rd
- 1844 Main St Unit 1844
- 1687 Main St
- 42 Sunnyside Ln
- 30 Brewster Ln
- 45 Millrun Ln Unit 45