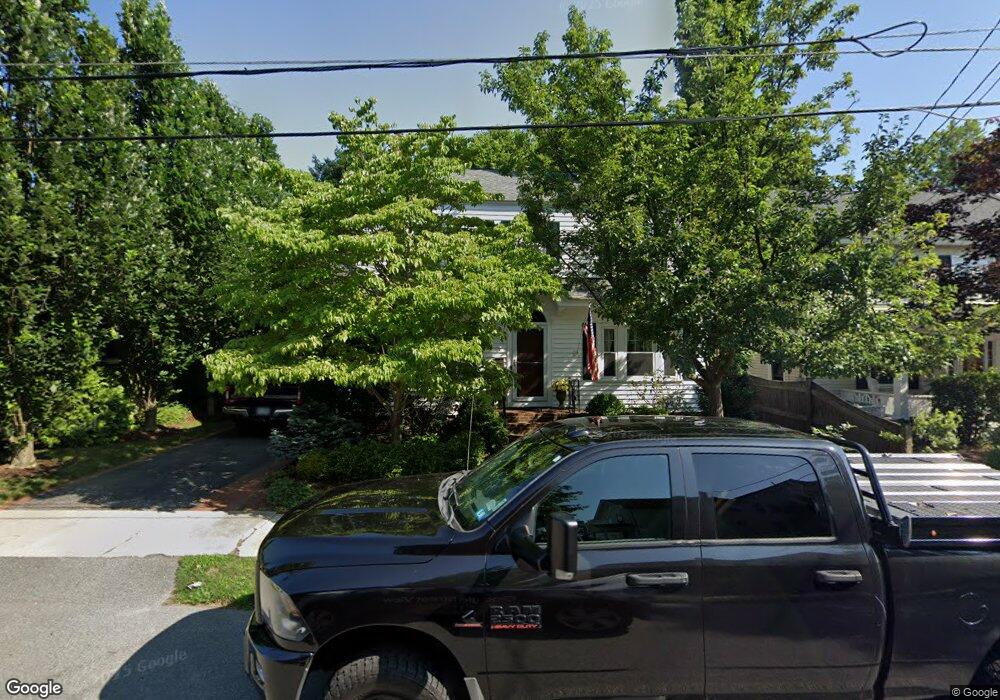
5 Fowell Ave Nashua, NH 03060
South End Nashua NeighborhoodEstimated Value: $529,000 - $550,388
3
Beds
2
Baths
1,736
Sq Ft
$311/Sq Ft
Est. Value
About This Home
This home is located at 5 Fowell Ave, Nashua, NH 03060 and is currently estimated at $540,347, approximately $311 per square foot. 5 Fowell Ave is a home located in Hillsborough County with nearby schools including Sunset Heights Elementary School, Elm Street Middle School, and Nashua High School North.
Ownership History
Date
Name
Owned For
Owner Type
Purchase Details
Closed on
Sep 30, 2003
Sold by
Laquerre Marc C and Laquerre Claudia D
Bought by
Holmes Robin M
Current Estimated Value
Home Financials for this Owner
Home Financials are based on the most recent Mortgage that was taken out on this home.
Original Mortgage
$233,250
Interest Rate
6.29%
Mortgage Type
Purchase Money Mortgage
Purchase Details
Closed on
Jun 2, 1998
Sold by
Bank Of New Hampshire
Bought by
Laquerre Marc C and Laquerre Claudia D
Purchase Details
Closed on
Feb 13, 1998
Sold by
Freitas Maryann and Freitas Antonio
Bought by
Bank Of New Hampshire
Create a Home Valuation Report for This Property
The Home Valuation Report is an in-depth analysis detailing your home's value as well as a comparison with similar homes in the area
Home Values in the Area
Average Home Value in this Area
Purchase History
| Date | Buyer | Sale Price | Title Company |
|---|---|---|---|
| Holmes Robin M | $237,000 | -- | |
| Laquerre Marc C | $112,000 | -- | |
| Bank Of New Hampshire | $127,900 | -- |
Source: Public Records
Mortgage History
| Date | Status | Borrower | Loan Amount |
|---|---|---|---|
| Open | Bank Of New Hampshire | $175,826 | |
| Closed | Bank Of New Hampshire | $201,236 | |
| Closed | Bank Of New Hampshire | $20,000 | |
| Closed | Bank Of New Hampshire | $233,250 |
Source: Public Records
Tax History Compared to Growth
Tax History
| Year | Tax Paid | Tax Assessment Tax Assessment Total Assessment is a certain percentage of the fair market value that is determined by local assessors to be the total taxable value of land and additions on the property. | Land | Improvement |
|---|---|---|---|---|
| 2024 | $7,263 | $456,800 | $126,900 | $329,900 |
| 2023 | $6,851 | $375,800 | $101,500 | $274,300 |
| 2022 | $6,791 | $375,800 | $101,500 | $274,300 |
| 2021 | $5,977 | $257,400 | $67,700 | $189,700 |
| 2020 | $6,328 | $257,300 | $67,700 | $189,600 |
| 2019 | $5,599 | $257,300 | $67,700 | $189,600 |
| 2018 | $3,974 | $257,300 | $67,700 | $189,600 |
| 2017 | $4,998 | $193,800 | $66,600 | $127,200 |
| 2016 | $5,789 | $193,800 | $66,600 | $127,200 |
| 2015 | $4,754 | $193,800 | $66,600 | $127,200 |
| 2014 | $4,661 | $193,800 | $66,600 | $127,200 |
Source: Public Records
Map
Nearby Homes
- 27 Fifield St Unit 13
- 1 Circle Ave
- 15 Lovell St Unit 3
- 15 Lovell St Unit 10
- 6 Hayden St
- 36 Eastman St Unit 26
- 15 Learned St Unit 123
- 63 Dexter St
- 2 Lyons St
- 24 E Otterson St
- 17 Herrick St
- 65 Allds St
- 97 Linwood St
- 8 Buck St Unit 10
- 5 Mulberry St
- 22 Wilder St
- 13 Mulvanity St
- 4 Badger St
- 61 Spindlewick Dr
- 30 Ledge St