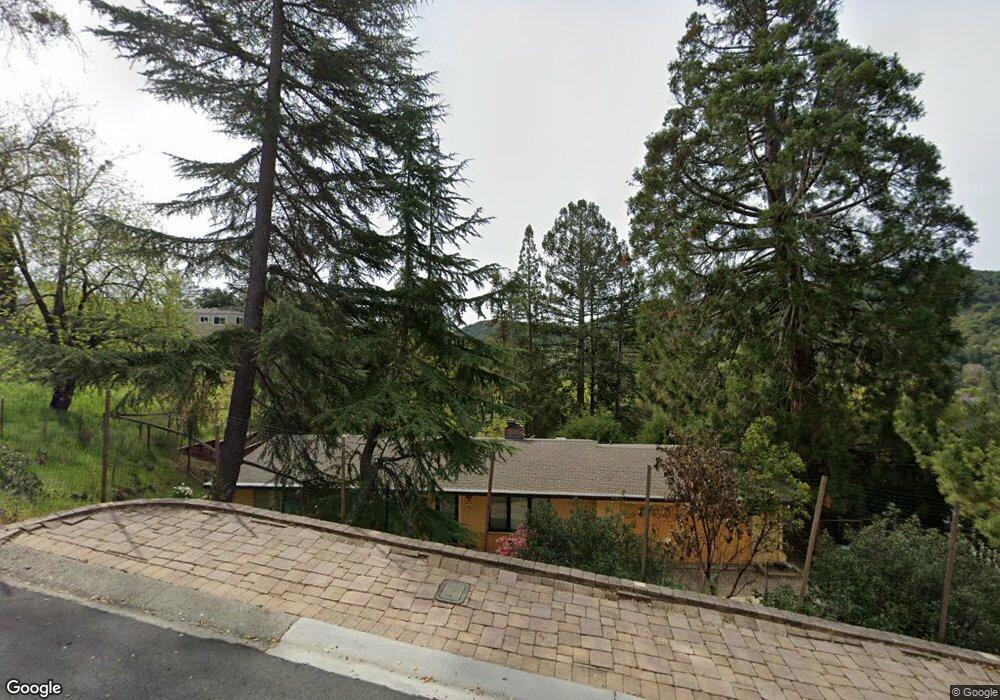
5 Francisco Ct Orinda, CA 94563
Del Rey NeighborhoodEstimated Value: $1,611,000 - $2,461,353
3
Beds
2
Baths
1,322
Sq Ft
$1,492/Sq Ft
Est. Value
About This Home
This home is located at 5 Francisco Ct, Orinda, CA 94563 and is currently estimated at $1,971,838, approximately $1,491 per square foot. 5 Francisco Ct is a home located in Contra Costa County with nearby schools including Del Rey Elementary School, Orinda Intermediate School, and Miramonte High School.
Ownership History
Date
Name
Owned For
Owner Type
Purchase Details
Closed on
Mar 24, 2014
Sold by
Dudley Patricia
Bought by
Chatterjee Rajiv and Grover Purva
Current Estimated Value
Home Financials for this Owner
Home Financials are based on the most recent Mortgage that was taken out on this home.
Original Mortgage
$625,500
Outstanding Balance
$472,481
Interest Rate
4.25%
Mortgage Type
New Conventional
Estimated Equity
$1,499,357
Purchase Details
Closed on
Nov 22, 2000
Sold by
Defrenne Gilbert R and Defrenne Kristine
Bought by
Dudley Dr Patricia
Create a Home Valuation Report for This Property
The Home Valuation Report is an in-depth analysis detailing your home's value as well as a comparison with similar homes in the area
Home Values in the Area
Average Home Value in this Area
Purchase History
| Date | Buyer | Sale Price | Title Company |
|---|---|---|---|
| Chatterjee Rajiv | $921,000 | Old Republic Title Company | |
| Dudley Dr Patricia | $465,000 | Placer Title Company |
Source: Public Records
Mortgage History
| Date | Status | Borrower | Loan Amount |
|---|---|---|---|
| Open | Chatterjee Rajiv | $625,500 |
Source: Public Records
Tax History Compared to Growth
Tax History
| Year | Tax Paid | Tax Assessment Tax Assessment Total Assessment is a certain percentage of the fair market value that is determined by local assessors to be the total taxable value of land and additions on the property. | Land | Improvement |
|---|---|---|---|---|
| 2025 | $16,062 | $1,654,010 | $956,168 | $697,842 |
| 2024 | $14,470 | $1,221,873 | $937,420 | $284,453 |
| 2023 | $14,470 | $1,085,171 | $919,040 | $166,131 |
| 2022 | $14,012 | $1,063,894 | $901,020 | $162,874 |
| 2021 | $13,734 | $1,043,034 | $883,353 | $159,681 |
| 2019 | $13,556 | $1,012,099 | $857,153 | $154,946 |
| 2018 | $12,525 | $992,255 | $840,347 | $151,908 |
| 2017 | $12,179 | $972,800 | $823,870 | $148,930 |
| 2016 | $11,884 | $953,726 | $807,716 | $146,010 |
| 2015 | $11,819 | $939,401 | $795,584 | $143,817 |
| 2014 | $7,725 | $573,985 | $317,133 | $256,852 |
Source: Public Records
Map
Nearby Homes
- 33 Altamount Dr
- 12 La Cresta Rd
- 24 Valencia Rd
- 13 Carmen Ct
- 8 Southwaite Ct
- 12 Lost Valley Dr
- 81 Coral Dr
- 42 Crestview Dr
- 2 Dolores Way
- 40 Hilldale Ct
- 5 Corte Sombrita
- 47 Miramonte Dr
- 231 Orchard Rd
- 62 Warfield Dr
- 58 Ashbrook Place
- 205 Crestview Dr
- 128 Glorietta Blvd
- 82 Zander Dr
- 58 Zander Ct
- 1725 Spyglass Ln