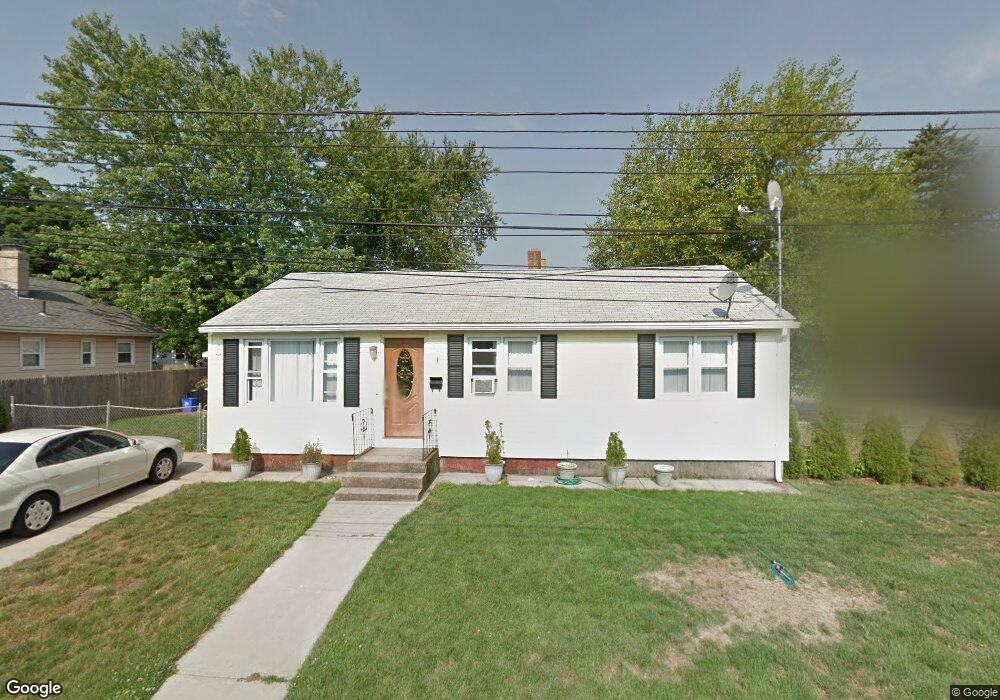
5 Gail Ave Cranston, RI 02905
Edgewood NeighborhoodEstimated Value: $363,000 - $403,129
3
Beds
1
Bath
1,600
Sq Ft
$244/Sq Ft
Est. Value
About This Home
This home is located at 5 Gail Ave, Cranston, RI 02905 and is currently estimated at $390,032, approximately $243 per square foot. 5 Gail Ave is a home located in Providence County with nearby schools including Edgewood Highland Elementary School, Edward S. Rhodes School, and Park View Middle School.
Ownership History
Date
Name
Owned For
Owner Type
Purchase Details
Closed on
Aug 31, 2011
Sold by
Dicristofaro L E
Bought by
Amaral Mario J and Amaral Bruna J
Current Estimated Value
Purchase Details
Closed on
Aug 11, 2011
Sold by
Amaral Mario and Amaral Bruna J
Bought by
Dicristofaro Lawrence
Purchase Details
Closed on
Jan 29, 2002
Sold by
Cornell Shirley
Bought by
Amaral Brena J and Amaral Mario
Create a Home Valuation Report for This Property
The Home Valuation Report is an in-depth analysis detailing your home's value as well as a comparison with similar homes in the area
Home Values in the Area
Average Home Value in this Area
Purchase History
| Date | Buyer | Sale Price | Title Company |
|---|---|---|---|
| Amaral Mario J | -- | -- | |
| Dicristofaro Lawrence | $2,186 | -- | |
| Amaral Brena J | $105,000 | -- |
Source: Public Records
Mortgage History
| Date | Status | Borrower | Loan Amount |
|---|---|---|---|
| Previous Owner | Amaral Brena J | $178,500 | |
| Previous Owner | Amaral Brena J | $146,500 | |
| Previous Owner | Amaral Brena J | $120,000 |
Source: Public Records
Tax History Compared to Growth
Tax History
| Year | Tax Paid | Tax Assessment Tax Assessment Total Assessment is a certain percentage of the fair market value that is determined by local assessors to be the total taxable value of land and additions on the property. | Land | Improvement |
|---|---|---|---|---|
| 2025 | $4,185 | $301,500 | $101,400 | $200,100 |
| 2024 | $4,103 | $301,500 | $101,400 | $200,100 |
| 2023 | $3,767 | $199,300 | $69,900 | $129,400 |
| 2022 | $3,689 | $199,300 | $69,900 | $129,400 |
| 2021 | $3,587 | $199,300 | $69,900 | $129,400 |
| 2020 | $3,552 | $171,000 | $73,300 | $97,700 |
| 2019 | $3,552 | $171,000 | $73,300 | $97,700 |
| 2018 | $3,470 | $171,000 | $73,300 | $97,700 |
| 2017 | $3,540 | $154,300 | $66,600 | $87,700 |
| 2016 | $3,464 | $154,300 | $66,600 | $87,700 |
| 2015 | $3,464 | $154,300 | $66,600 | $87,700 |
| 2014 | $3,440 | $150,600 | $66,600 | $84,000 |
Source: Public Records
Map
Nearby Homes
- 63 Taft St
- 42 Netherlands Ave
- 73 Western Promenade
- 19 Warwick Ave
- 10 Sylvan Ave
- 27 Cliffdale Ave
- 73 Moorland Ave
- 28 Sylvan Ave
- 29 Malvern Ave
- 171 Norwood Ave
- 126 Columbia Ave
- 52 Parkside Dr
- 303 Narragansett St
- 5 Lakeside Ave
- 1291 Narragansett Blvd Unit 4
- 1232 Narragansett Blvd
- 61 Cyr St
- 274 Montgomery Ave
- 166 Narragansett St
- 243 Bay View Ave