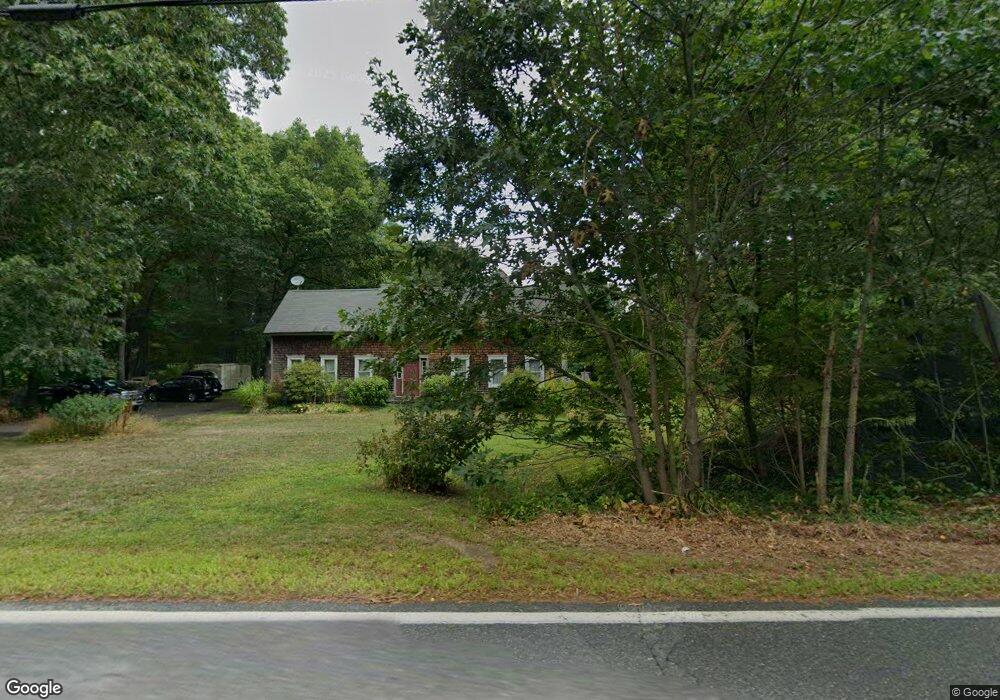
5 Gate St Carver, MA 02330
Estimated Value: $676,000 - $787,000
4
Beds
3
Baths
2,716
Sq Ft
$261/Sq Ft
Est. Value
About This Home
This home is located at 5 Gate St, Carver, MA 02330 and is currently estimated at $707,939, approximately $260 per square foot. 5 Gate St is a home located in Plymouth County with nearby schools including Carver Elementary School and Carver Middle/High School.
Ownership History
Date
Name
Owned For
Owner Type
Purchase Details
Closed on
Feb 29, 2008
Sold by
Fruzetti Richard and Fruzetti Gina M
Bought by
Ridlon Robert M and Ahern-Ridlon Deborah J
Current Estimated Value
Home Financials for this Owner
Home Financials are based on the most recent Mortgage that was taken out on this home.
Original Mortgage
$278,000
Interest Rate
5.8%
Mortgage Type
Purchase Money Mortgage
Purchase Details
Closed on
Dec 30, 1994
Sold by
Four Rt and Medeiros Edward K
Bought by
Gabriele Gina M
Create a Home Valuation Report for This Property
The Home Valuation Report is an in-depth analysis detailing your home's value as well as a comparison with similar homes in the area
Home Values in the Area
Average Home Value in this Area
Purchase History
| Date | Buyer | Sale Price | Title Company |
|---|---|---|---|
| Ridlon Robert M | $378,000 | -- | |
| Gabriele Gina M | $66,000 | -- |
Source: Public Records
Mortgage History
| Date | Status | Borrower | Loan Amount |
|---|---|---|---|
| Open | Gabriele Gina M | $267,000 | |
| Closed | Gabriele Gina M | $278,000 | |
| Previous Owner | Gabriele Gina M | $277,900 | |
| Previous Owner | Gabriele Gina M | $115,000 |
Source: Public Records
Tax History Compared to Growth
Tax History
| Year | Tax Paid | Tax Assessment Tax Assessment Total Assessment is a certain percentage of the fair market value that is determined by local assessors to be the total taxable value of land and additions on the property. | Land | Improvement |
|---|---|---|---|---|
| 2025 | $7,118 | $513,200 | $154,900 | $358,300 |
| 2024 | $6,725 | $474,600 | $151,900 | $322,700 |
| 2023 | $6,493 | $445,000 | $151,900 | $293,100 |
| 2022 | $6,132 | $383,700 | $129,900 | $253,800 |
| 2021 | $5,849 | $345,300 | $116,000 | $229,300 |
| 2020 | $5,575 | $324,300 | $108,400 | $215,900 |
| 2019 | $5,379 | $315,500 | $105,200 | $210,300 |
| 2018 | $5,203 | $295,100 | $105,200 | $189,900 |
| 2017 | $4,840 | $273,600 | $101,200 | $172,400 |
| 2016 | $4,474 | $262,700 | $96,400 | $166,300 |
| 2015 | $4,356 | $256,100 | $96,400 | $159,700 |
| 2014 | $4,346 | $255,500 | $121,900 | $133,600 |
Source: Public Records
Map
Nearby Homes