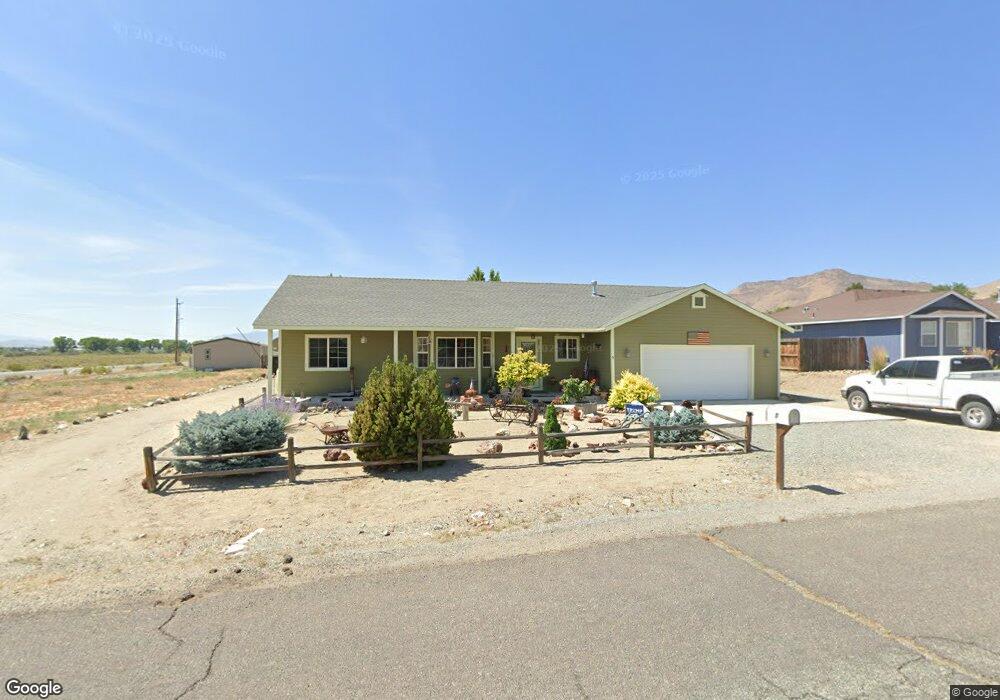
5 Gemstone Dr Unit 1 Yerington, NV 89447
Estimated Value: $318,000 - $388,000
3
Beds
2
Baths
1,600
Sq Ft
$214/Sq Ft
Est. Value
About This Home
This home is located at 5 Gemstone Dr Unit 1, Yerington, NV 89447 and is currently estimated at $343,004, approximately $214 per square foot. 5 Gemstone Dr Unit 1 is a home located in Lyon County with nearby schools including Yerington Elementary School, Yerington Intermediate School, and Yerington High School.
Ownership History
Date
Name
Owned For
Owner Type
Purchase Details
Closed on
May 4, 2011
Sold by
Smith Wesleya and Smith Beverly A
Bought by
Smith Wesley A and Smith Beverly A
Current Estimated Value
Purchase Details
Closed on
Apr 15, 2011
Sold by
Federal National Mortgage Association
Bought by
Smith Wesley A and Smith Beverly A
Purchase Details
Closed on
Mar 24, 2011
Sold by
Stephens Michael
Bought by
Federal National Mortgage Association
Purchase Details
Closed on
Aug 30, 2007
Sold by
Stephens Lauretta L
Bought by
Stephens Michael
Home Financials for this Owner
Home Financials are based on the most recent Mortgage that was taken out on this home.
Original Mortgage
$181,000
Interest Rate
6.74%
Mortgage Type
New Conventional
Create a Home Valuation Report for This Property
The Home Valuation Report is an in-depth analysis detailing your home's value as well as a comparison with similar homes in the area
Home Values in the Area
Average Home Value in this Area
Purchase History
| Date | Buyer | Sale Price | Title Company |
|---|---|---|---|
| Smith Wesley A | -- | None Available | |
| Smith Wesley A | $118,000 | Servicelink | |
| Federal National Mortgage Association | $188,484 | First American National Defa | |
| Stephens Michael | -- | Northern Nevada Title Co | |
| Stephens Michael | $195,000 | Northern Nevada Title Co |
Source: Public Records
Mortgage History
| Date | Status | Borrower | Loan Amount |
|---|---|---|---|
| Previous Owner | Stephens Michael | $181,000 |
Source: Public Records
Tax History Compared to Growth
Tax History
| Year | Tax Paid | Tax Assessment Tax Assessment Total Assessment is a certain percentage of the fair market value that is determined by local assessors to be the total taxable value of land and additions on the property. | Land | Improvement |
|---|---|---|---|---|
| 2025 | $1,999 | $90,069 | $25,200 | $64,869 |
| 2024 | $1,941 | $89,712 | $24,500 | $65,212 |
| 2023 | $1,941 | $85,699 | $24,500 | $61,199 |
| 2022 | $1,824 | $73,267 | $16,450 | $56,817 |
| 2021 | $1,767 | $65,993 | $10,623 | $55,370 |
| 2020 | $1,715 | $63,414 | $10,620 | $52,794 |
| 2019 | $1,666 | $61,537 | $10,620 | $50,917 |
| 2018 | $1,612 | $54,047 | $4,410 | $49,637 |
| 2017 | $1,565 | $54,006 | $4,410 | $49,596 |
| 2016 | $1,607 | $44,796 | $4,410 | $40,386 |
| 2015 | $1,523 | $54,341 | $4,410 | $49,931 |
| 2014 | $1,479 | $43,454 | $4,410 | $39,044 |
Source: Public Records
Map
Nearby Homes
- 7 Gemstone Dr
- 7 Gemstone Ave
- 4 Shelter Hills Dr
- 6 Shelter Hills Dr
- 2 Shelter Hills Dr
- 2 Sheltered Hills Dr
- 4 Gemstone Dr
- 9 Gemstone Dr
- 8 Shelter Hills Dr
- 10 Shelter Hills Dr
- 11 Gemstone Dr
- 11 Gemstone Ave
- 385 Nevada 339
- 385 State Route 339
- 12 Shelter Hills Dr
- 13 Gemstone Dr
- 383 State Route 339
- 379 Nevada 339
- 15 Gemstone Dr
- 14 Shelter Hills Dr