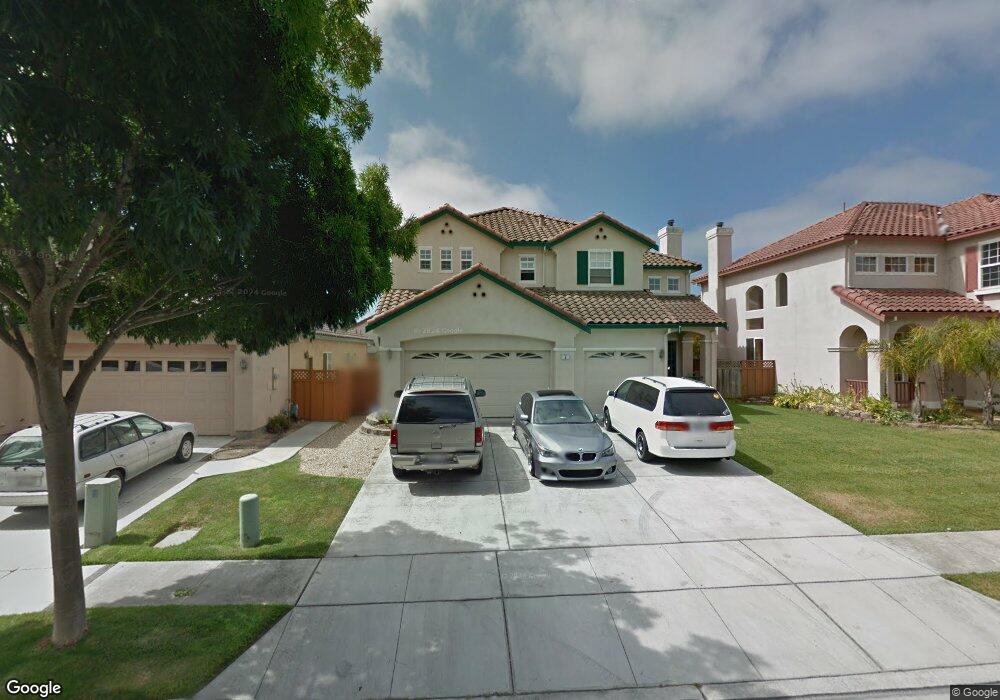
5 Glen Falls Cir Salinas, CA 93906
Creekbridge NeighborhoodEstimated Value: $889,589 - $1,027,000
5
Beds
3
Baths
2,605
Sq Ft
$367/Sq Ft
Est. Value
About This Home
This home is located at 5 Glen Falls Cir, Salinas, CA 93906 and is currently estimated at $956,647, approximately $367 per square foot. 5 Glen Falls Cir is a home located in Monterey County with nearby schools including John E. Steinbeck Elementary School, Harden Middle School, and Alisal High School.
Ownership History
Date
Name
Owned For
Owner Type
Purchase Details
Closed on
Apr 19, 2007
Sold by
Shah Amish A and Shah Shital A
Bought by
Shah Amish A and Shah Shital A
Current Estimated Value
Purchase Details
Closed on
Sep 10, 2002
Sold by
Speed Steven Kent and Speed Karen P
Bought by
Shah Amish A and Shah Shital A
Home Financials for this Owner
Home Financials are based on the most recent Mortgage that was taken out on this home.
Original Mortgage
$422,100
Outstanding Balance
$176,326
Interest Rate
6.24%
Estimated Equity
$780,321
Purchase Details
Closed on
Aug 28, 2002
Sold by
Va
Bought by
Speed Steven Kent and Speed Karen P
Home Financials for this Owner
Home Financials are based on the most recent Mortgage that was taken out on this home.
Original Mortgage
$422,100
Outstanding Balance
$176,326
Interest Rate
6.24%
Estimated Equity
$780,321
Purchase Details
Closed on
Jul 14, 2000
Sold by
Creekbridge Homes Lp
Bought by
Va
Create a Home Valuation Report for This Property
The Home Valuation Report is an in-depth analysis detailing your home's value as well as a comparison with similar homes in the area
Home Values in the Area
Average Home Value in this Area
Purchase History
| Date | Buyer | Sale Price | Title Company |
|---|---|---|---|
| Shah Amish A | -- | None Available | |
| Shah Amish A | $469,000 | Fidelity Title | |
| Speed Steven Kent | -- | Fidelity Title | |
| Va | $302,500 | Old Republic Title Company |
Source: Public Records
Mortgage History
| Date | Status | Borrower | Loan Amount |
|---|---|---|---|
| Open | Shah Amish A | $422,100 |
Source: Public Records
Tax History Compared to Growth
Tax History
| Year | Tax Paid | Tax Assessment Tax Assessment Total Assessment is a certain percentage of the fair market value that is determined by local assessors to be the total taxable value of land and additions on the property. | Land | Improvement |
|---|---|---|---|---|
| 2025 | $9,103 | $679,272 | $202,763 | $476,509 |
| 2024 | $9,103 | $665,954 | $198,788 | $467,166 |
| 2023 | $8,954 | $652,897 | $194,891 | $458,006 |
| 2022 | $8,074 | $640,096 | $191,070 | $449,026 |
| 2021 | $8,074 | $627,546 | $187,324 | $440,222 |
| 2020 | $7,980 | $621,113 | $185,404 | $435,709 |
| 2019 | $8,230 | $608,935 | $181,769 | $427,166 |
| 2018 | $7,402 | $568,000 | $170,000 | $398,000 |
| 2017 | $7,394 | $536,000 | $160,000 | $376,000 |
| 2016 | $7,089 | $531,000 | $159,000 | $372,000 |
| 2015 | $6,492 | $482,000 | $144,000 | $338,000 |
| 2014 | $5,791 | $436,000 | $130,000 | $306,000 |
Source: Public Records
Map
Nearby Homes
- 15 Stony Brook Cir
- 822 Castleton St
- 1615 Newport Ct
- 734 Los Coches Ave
- 730 Los Coches Ave
- 1731 Pescadero Dr
- 18 Suffield Cir
- 1049 Twin Creeks Dr
- 634 Yreka Dr
- 587 Mariposa St
- 607 Calaveras Dr
- 1780 Truckee Way
- 643 Rainier Dr
- 629 Chaparral St
- 1808 Bradbury St
- 794 Danbury St
- 1313 Ramona Ave
- 383 Natividad Rd
- 1875 Lancashire Dr
- 8 Bristol Cir
- 9 Glen Falls Cir
- 1 Glen Falls Cir
- 6 White River Cir
- 2 White River Cir
- 13 Glen Falls Cir
- 10 White River Cir
- 8 Glen Falls Cir
- 14 White River Cir
- 4 Glen Falls Cir
- 17 Glen Falls Cir
- 12 Glen Falls Cir
- 16 Glen Falls Cir
- 1626 Stony Brook Dr
- 18 White River Cir
- 1622 Stony Brook Dr
- 1630 Stony Brook Dr
- 1618 Stony Brook Dr
- 21 Glen Falls Cir
- 1634 Stony Brook Dr
- 3 White River Cir