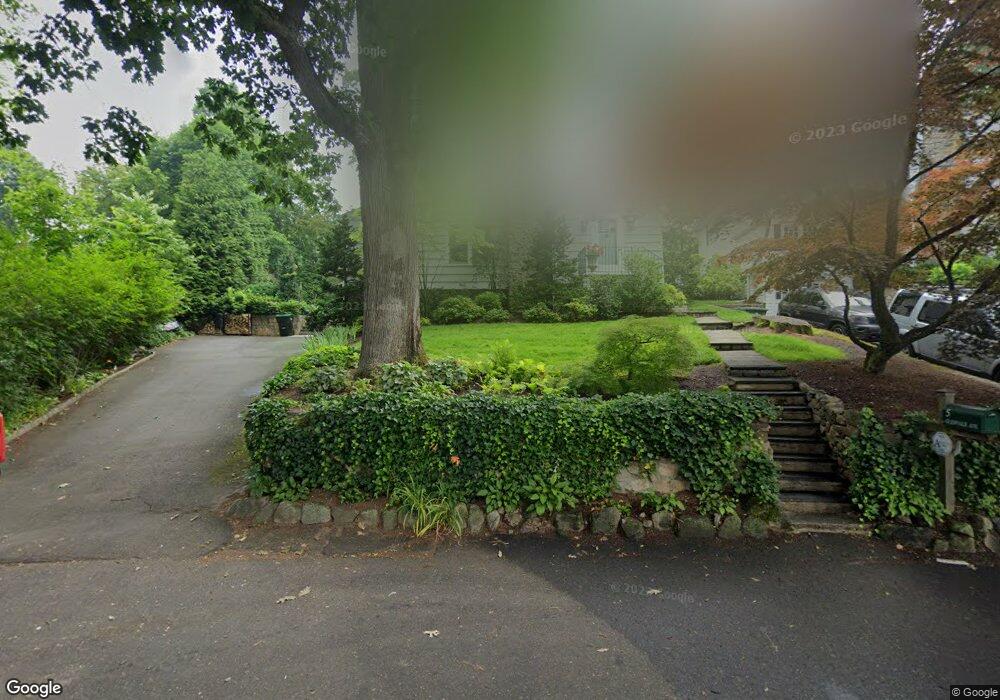
5 Glenvale Ave Darien, CT 06820
Estimated Value: $1,700,000 - $2,121,064
4
Beds
3
Baths
2,451
Sq Ft
$797/Sq Ft
Est. Value
About This Home
This home is located at 5 Glenvale Ave, Darien, CT 06820 and is currently estimated at $1,953,516, approximately $797 per square foot. 5 Glenvale Ave is a home located in Fairfield County with nearby schools including Holmes Elementary School, Middlesex Middle School, and Darien High School.
Ownership History
Date
Name
Owned For
Owner Type
Purchase Details
Closed on
Mar 23, 2012
Sold by
Stevens Janet T
Bought by
Stevens Tere C
Current Estimated Value
Home Financials for this Owner
Home Financials are based on the most recent Mortgage that was taken out on this home.
Original Mortgage
$806,250
Interest Rate
3.86%
Purchase Details
Closed on
Dec 1, 2005
Sold by
Haslum Erick I and Haslum Carol R
Bought by
Stevens Gregory J and Clippard-Stevens Janet T
Home Financials for this Owner
Home Financials are based on the most recent Mortgage that was taken out on this home.
Original Mortgage
$695,900
Interest Rate
5.75%
Mortgage Type
Adjustable Rate Mortgage/ARM
Purchase Details
Closed on
Jun 18, 2001
Sold by
Kappan James D and Kappan Nancy E
Bought by
Haslan Erik I and Haslan Carol R
Purchase Details
Closed on
Jul 21, 1989
Sold by
Ayen Richard
Bought by
Kappas James
Create a Home Valuation Report for This Property
The Home Valuation Report is an in-depth analysis detailing your home's value as well as a comparison with similar homes in the area
Home Values in the Area
Average Home Value in this Area
Purchase History
| Date | Buyer | Sale Price | Title Company |
|---|---|---|---|
| Stevens Tere C | -- | -- | |
| Stevens Gregory J | $869,900 | -- | |
| Haslan Erik I | $540,000 | -- | |
| Kappas James | $309,500 | -- |
Source: Public Records
Mortgage History
| Date | Status | Borrower | Loan Amount |
|---|---|---|---|
| Open | Kappas James | $754,246 | |
| Closed | Kappas James | $806,250 | |
| Previous Owner | Kappas James | $695,900 |
Source: Public Records
Tax History
| Year | Tax Paid | Tax Assessment Tax Assessment Total Assessment is a certain percentage of the fair market value that is determined by local assessors to be the total taxable value of land and additions on the property. | Land | Improvement |
|---|---|---|---|---|
| 2025 | $15,946 | $1,030,120 | $689,220 | $340,900 |
| 2024 | $15,132 | $1,030,120 | $689,220 | $340,900 |
| 2023 | $13,205 | $749,840 | $459,480 | $290,360 |
| 2022 | $12,920 | $749,840 | $459,480 | $290,360 |
| 2021 | $10,285 | $749,840 | $459,480 | $290,360 |
| 2020 | $12,267 | $749,840 | $459,480 | $290,360 |
| 2019 | $12,350 | $749,840 | $459,480 | $290,360 |
| 2018 | $9,935 | $752,570 | $462,210 | $290,360 |
| 2017 | $8,809 | $748,790 | $458,430 | $290,360 |
| 2016 | $11,808 | $748,790 | $458,430 | $290,360 |
| 2015 | $11,494 | $748,790 | $458,430 | $290,360 |
| 2014 | $11,239 | $748,790 | $458,430 | $290,360 |
Source: Public Records
Map
Nearby Homes
- 17 Sunnyside Ave
- 43 Phillips Ln
- 3 Hickory Ln
- 22 Radio Place Unit 10
- 15 Waterbury Ln
- 35 Maple Tree Ave Unit 1
- 680 Hope St Unit 12
- 455 Hope St Unit 4B
- 7 Barnstable Ln
- 15 Charles St
- 8 Barnstable Ln
- 34 Crescent St Unit 2D
- 167 Hollow Tree Ridge Rd
- 166 Hollow Tree Ridge Rd
- 473 Hollow Tree Ridge Rd
- 71 Deleo Dr
- 78 Elizabeth Ave
- 910 Hope St Unit 5B
- 98 Scofield Ave
- 144 Toms Rd
- 9 Glenvale Ave
- 8 Sunnyside Ave
- 11 Glenvale Ave
- 6 Sunnyside Ave
- 10 Sunnyside Ave
- 12 Christie Hill Rd
- 8 Glenvale Ave
- 13 Glenvale Ave
- 18 Christie Hill Rd
- 12 Sunnyside Ave
- 10 Christie Hill Rd
- 24 Christie Hill Rd
- 14 Sunnyside Ave
- 55 Middlesex Rd
- 49 Middlesex Rd
- 47 Middlesex Rd
- 7 Sunnyside Ave
- 9 Sunnyside Ave
- 5 Sunnyside Ave
- 15 Christie Hill Rd
Your Personal Tour Guide
Ask me questions while you tour the home.