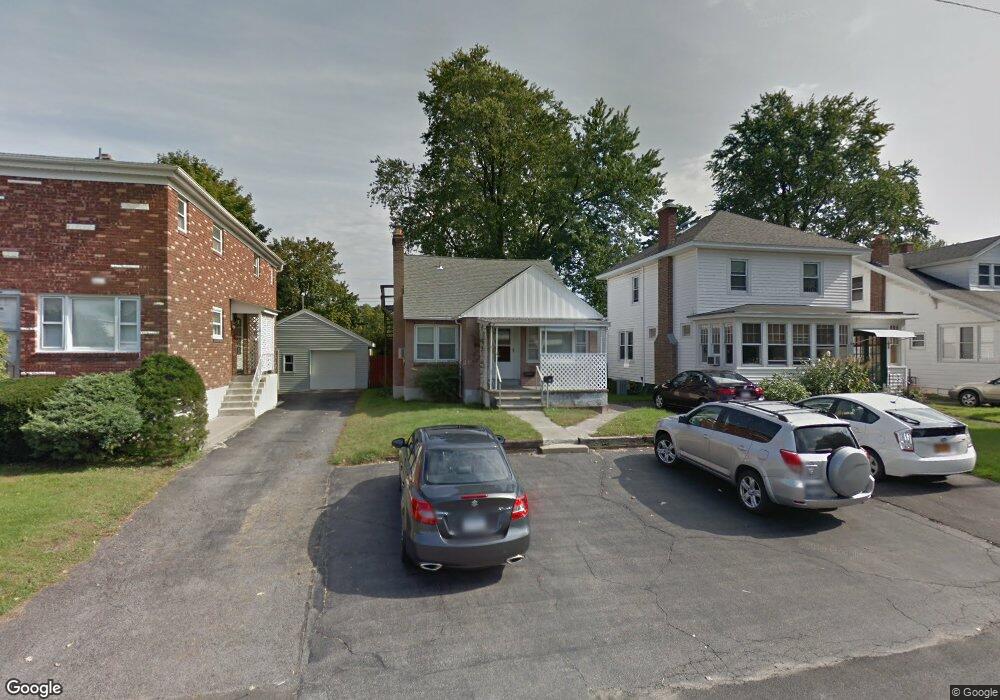
5 Glynn St Albany, NY 12203
Campus Area NeighborhoodEstimated Value: $239,000 - $259,000
2
Beds
2
Baths
1,057
Sq Ft
$233/Sq Ft
Est. Value
About This Home
This home is located at 5 Glynn St, Albany, NY 12203 and is currently estimated at $246,673, approximately $233 per square foot. 5 Glynn St is a home located in Albany County with nearby schools including Eagle Point Elementary School, William S Hackett Middle School, and Albany High School.
Ownership History
Date
Name
Owned For
Owner Type
Purchase Details
Closed on
May 5, 2010
Sold by
Estep Frank A and Estep Jean E
Bought by
Maltsev Valeriy
Current Estimated Value
Home Financials for this Owner
Home Financials are based on the most recent Mortgage that was taken out on this home.
Original Mortgage
$119,106
Outstanding Balance
$78,650
Interest Rate
4.75%
Mortgage Type
New Conventional
Estimated Equity
$168,023
Create a Home Valuation Report for This Property
The Home Valuation Report is an in-depth analysis detailing your home's value as well as a comparison with similar homes in the area
Home Values in the Area
Average Home Value in this Area
Purchase History
| Date | Buyer | Sale Price | Title Company |
|---|---|---|---|
| Maltsev Valeriy | $130,000 | Fidelity Natl Title Ins Co |
Source: Public Records
Mortgage History
| Date | Status | Borrower | Loan Amount |
|---|---|---|---|
| Open | Maltsev Valeriy | $119,106 |
Source: Public Records
Tax History Compared to Growth
Tax History
| Year | Tax Paid | Tax Assessment Tax Assessment Total Assessment is a certain percentage of the fair market value that is determined by local assessors to be the total taxable value of land and additions on the property. | Land | Improvement |
|---|---|---|---|---|
| 2024 | $3,862 | $166,000 | $33,200 | $132,800 |
| 2023 | $3,073 | $89,000 | $17,800 | $71,200 |
| 2022 | $2,929 | $89,000 | $17,800 | $71,200 |
| 2021 | $2,897 | $89,000 | $17,800 | $71,200 |
| 2020 | $2,739 | $89,000 | $17,800 | $71,200 |
| 2019 | $3,504 | $89,000 | $17,800 | $71,200 |
| 2018 | $2,735 | $89,000 | $17,800 | $71,200 |
| 2017 | $3,244 | $89,000 | $17,800 | $71,200 |
| 2016 | $2,658 | $89,000 | $17,800 | $71,200 |
| 2015 | $4,126 | $130,000 | $27,900 | $102,100 |
| 2014 | -- | $130,000 | $27,900 | $102,100 |
Source: Public Records
Map
Nearby Homes