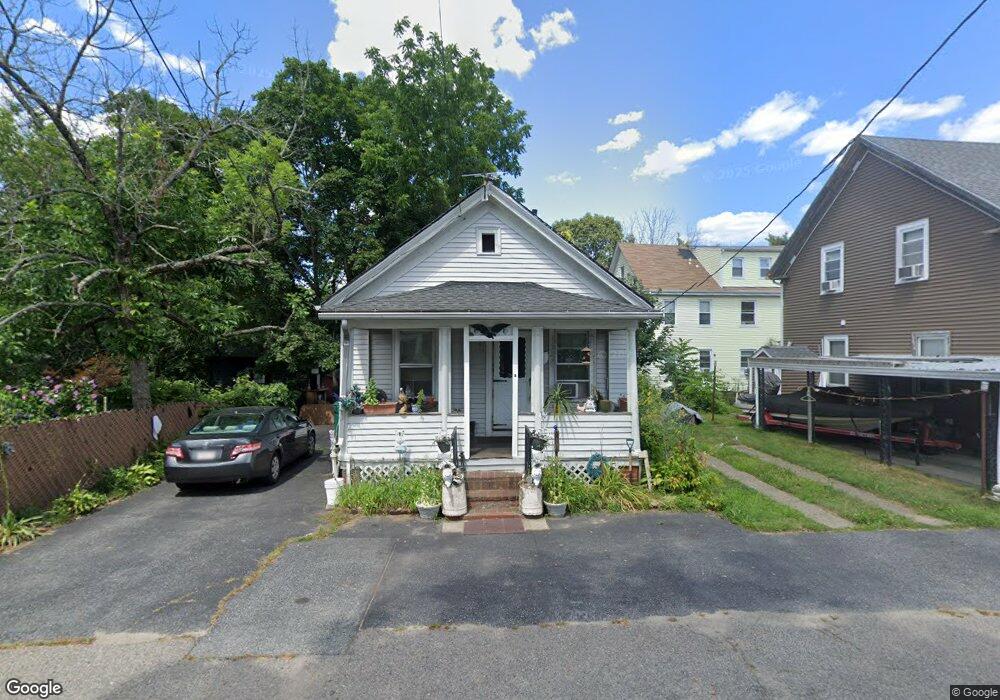
5 Goff St Attleboro, MA 02703
Estimated Value: $299,455 - $405,000
3
Beds
1
Bath
720
Sq Ft
$505/Sq Ft
Est. Value
About This Home
This home is located at 5 Goff St, Attleboro, MA 02703 and is currently estimated at $363,864, approximately $505 per square foot. 5 Goff St is a home located in Bristol County with nearby schools including Peter Thacher Elementary School, Robert J. Coelho Middle School, and Attleboro High School.
Ownership History
Date
Name
Owned For
Owner Type
Purchase Details
Closed on
Sep 6, 1990
Sold by
North Easton Savs Bk
Bought by
Rainha Joseph M
Current Estimated Value
Home Financials for this Owner
Home Financials are based on the most recent Mortgage that was taken out on this home.
Original Mortgage
$45,000
Interest Rate
9.83%
Mortgage Type
Purchase Money Mortgage
Create a Home Valuation Report for This Property
The Home Valuation Report is an in-depth analysis detailing your home's value as well as a comparison with similar homes in the area
Home Values in the Area
Average Home Value in this Area
Purchase History
| Date | Buyer | Sale Price | Title Company |
|---|---|---|---|
| Rainha Joseph M | $60,000 | -- |
Source: Public Records
Mortgage History
| Date | Status | Borrower | Loan Amount |
|---|---|---|---|
| Open | Rainha Joseph M | $41,873 | |
| Closed | Rainha Joseph M | $45,000 |
Source: Public Records
Tax History Compared to Growth
Tax History
| Year | Tax Paid | Tax Assessment Tax Assessment Total Assessment is a certain percentage of the fair market value that is determined by local assessors to be the total taxable value of land and additions on the property. | Land | Improvement |
|---|---|---|---|---|
| 2025 | $2,633 | $209,800 | $86,200 | $123,600 |
| 2024 | $2,659 | $208,900 | $86,200 | $122,700 |
| 2023 | $2,444 | $178,500 | $78,400 | $100,100 |
| 2022 | $2,522 | $174,500 | $74,700 | $99,800 |
| 2021 | $2,485 | $167,900 | $71,800 | $96,100 |
| 2020 | $2,280 | $156,600 | $69,700 | $86,900 |
| 2019 | $2,089 | $147,500 | $68,300 | $79,200 |
| 2018 | $1,989 | $134,200 | $66,400 | $67,800 |
| 2017 | $1,859 | $127,800 | $66,400 | $61,400 |
| 2016 | $1,783 | $120,300 | $62,000 | $58,300 |
| 2015 | $1,648 | $112,000 | $62,000 | $50,000 |
| 2014 | $1,541 | $103,800 | $58,800 | $45,000 |
Source: Public Records
Map
Nearby Homes
- 1091 S Main St
- 1091 S Main St Unit 2
- 1091 S Main St Unit 3
- 1091 S Main St Unit 1
- 86 Knight Ave
- 1097 S Main St
- 1101 S Main St
- 98 Knight Ave
- 1096 S Main St
- 84 Knight Ave
- 104 Knight Ave
- 106 Knight Ave Unit 106
- 10 Fuller Ave Unit 24
- 10 Fuller Ave Unit 23
- 10 Fuller Ave Unit 22
- 10 Fuller Ave Unit 21
- 10 Fuller Ave Unit 20
- 10 Fuller Ave Unit 19
- 10 Fuller Ave Unit 18
- 10 Fuller Ave Unit 17