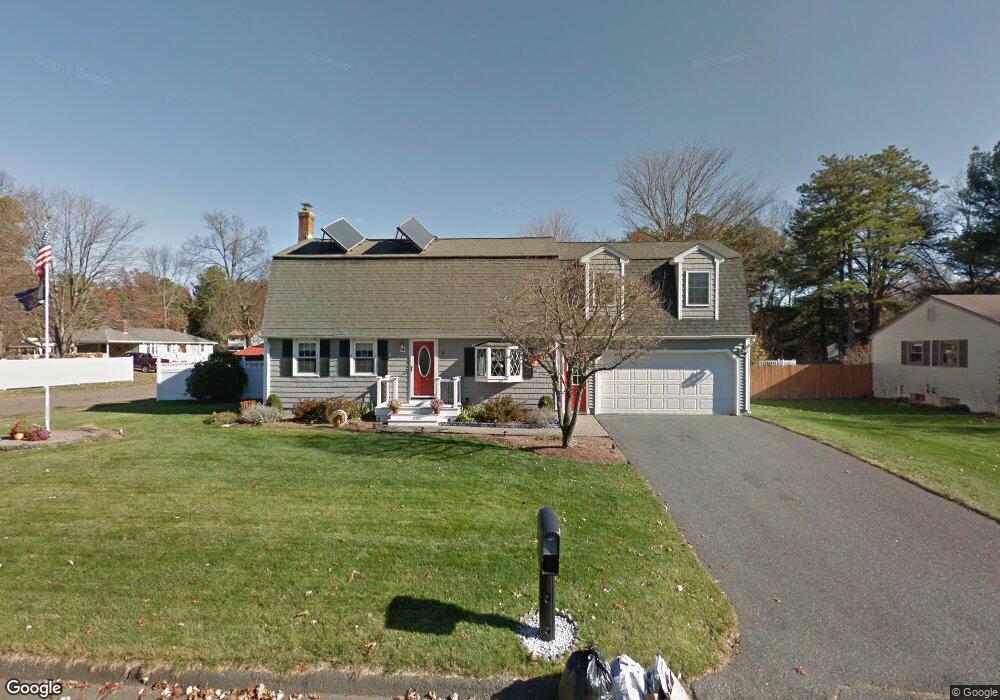
5 Gula Dr Easthampton, MA 01027
Estimated Value: $444,000 - $510,000
3
Beds
3
Baths
2,060
Sq Ft
$237/Sq Ft
Est. Value
About This Home
This home is located at 5 Gula Dr, Easthampton, MA 01027 and is currently estimated at $487,469, approximately $236 per square foot. 5 Gula Dr is a home located in Hampshire County with nearby schools including Easthampton High School, Calvary Baptist Christian School, and Tri-County Schools.
Ownership History
Date
Name
Owned For
Owner Type
Purchase Details
Closed on
Dec 11, 1992
Sold by
Korona Christine M and Florek Holly L
Bought by
Korona Christine M
Current Estimated Value
Home Financials for this Owner
Home Financials are based on the most recent Mortgage that was taken out on this home.
Original Mortgage
$95,200
Interest Rate
8.16%
Create a Home Valuation Report for This Property
The Home Valuation Report is an in-depth analysis detailing your home's value as well as a comparison with similar homes in the area
Home Values in the Area
Average Home Value in this Area
Purchase History
| Date | Buyer | Sale Price | Title Company |
|---|---|---|---|
| Korona Christine M | $6,686 | -- |
Source: Public Records
Mortgage History
| Date | Status | Borrower | Loan Amount |
|---|---|---|---|
| Open | Korona Christine M | $50,000 | |
| Open | Korona Christine M | $92,800 | |
| Closed | Korona Christine M | $92,500 | |
| Closed | Korona Christine M | $95,200 |
Source: Public Records
Tax History
| Year | Tax Paid | Tax Assessment Tax Assessment Total Assessment is a certain percentage of the fair market value that is determined by local assessors to be the total taxable value of land and additions on the property. | Land | Improvement |
|---|---|---|---|---|
| 2025 | $6,121 | $447,800 | $118,600 | $329,200 |
| 2024 | $5,903 | $435,300 | $115,200 | $320,100 |
| 2023 | $4,418 | $301,600 | $90,700 | $210,900 |
| 2022 | $4,985 | $301,600 | $90,700 | $210,900 |
| 2021 | $5,490 | $313,000 | $90,700 | $222,300 |
| 2020 | $5,356 | $301,600 | $90,700 | $210,900 |
| 2019 | $4,669 | $302,000 | $90,700 | $211,300 |
| 2018 | $4,526 | $282,900 | $85,600 | $197,300 |
| 2017 | $4,416 | $272,400 | $82,200 | $190,200 |
| 2016 | $4,325 | $277,400 | $82,200 | $195,200 |
| 2015 | $4,203 | $277,400 | $82,200 | $195,200 |
Source: Public Records
Map
Nearby Homes
Your Personal Tour Guide
Ask me questions while you tour the home.