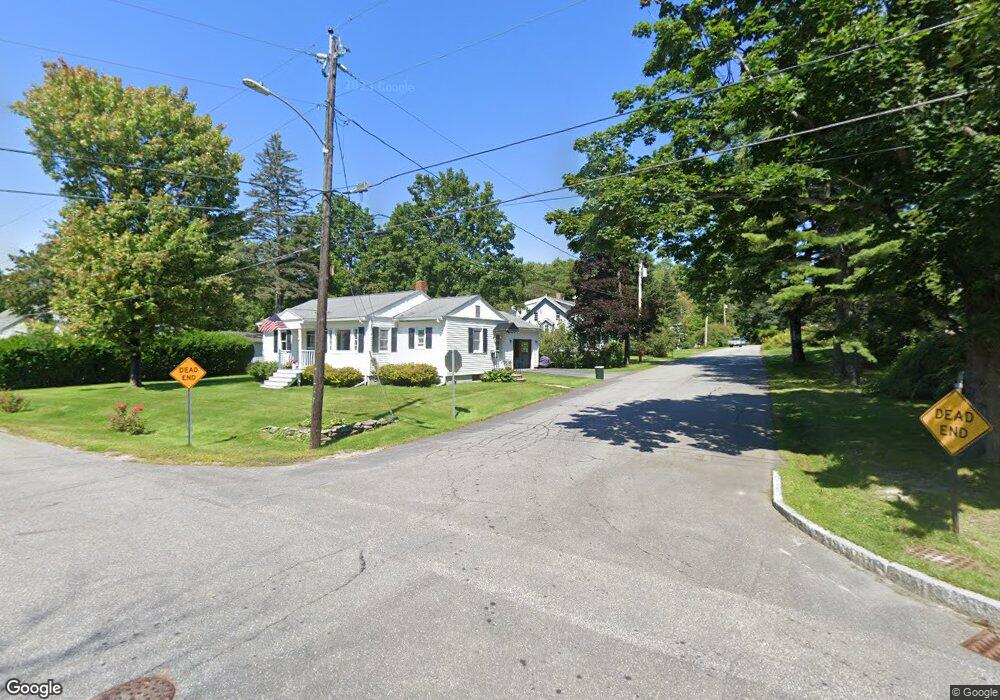
5 Guptil Ave Freeport, ME 04032
Estimated Value: $343,879 - $396,000
2
Beds
1
Bath
900
Sq Ft
$422/Sq Ft
Est. Value
About This Home
This home is located at 5 Guptil Ave, Freeport, ME 04032 and is currently estimated at $379,970, approximately $422 per square foot. 5 Guptil Ave is a home located in Cumberland County with nearby schools including Morse Street School, Mast Landing School, and Freeport Middle School.
Ownership History
Date
Name
Owned For
Owner Type
Purchase Details
Closed on
May 20, 2016
Sold by
Drapeau Jacqueline and Drapeau Therese L
Bought by
Drapeau Therese L
Current Estimated Value
Purchase Details
Closed on
Jul 27, 2009
Sold by
Staton Beverly and Staton Frank M
Bought by
Drapeau Therese L and Drapeau Jacqueline
Home Financials for this Owner
Home Financials are based on the most recent Mortgage that was taken out on this home.
Original Mortgage
$133,600
Interest Rate
5.58%
Mortgage Type
Unknown
Create a Home Valuation Report for This Property
The Home Valuation Report is an in-depth analysis detailing your home's value as well as a comparison with similar homes in the area
Home Values in the Area
Average Home Value in this Area
Purchase History
| Date | Buyer | Sale Price | Title Company |
|---|---|---|---|
| Drapeau Therese L | -- | -- | |
| Drapeau Therese L | -- | -- | |
| Drapeau Therese L | -- | -- | |
| Drapeau Therese L | -- | -- |
Source: Public Records
Mortgage History
| Date | Status | Borrower | Loan Amount |
|---|---|---|---|
| Open | Drapeau Therese L | $136,000 | |
| Closed | Drapeau Therese L | $133,600 | |
| Previous Owner | Drapeau Therese L | $100,001 |
Source: Public Records
Tax History Compared to Growth
Tax History
| Year | Tax Paid | Tax Assessment Tax Assessment Total Assessment is a certain percentage of the fair market value that is determined by local assessors to be the total taxable value of land and additions on the property. | Land | Improvement |
|---|---|---|---|---|
| 2024 | $3,048 | $228,300 | $124,800 | $103,500 |
| 2023 | $2,806 | $204,100 | $113,500 | $90,600 |
| 2022 | $2,619 | $191,900 | $101,300 | $90,600 |
| 2021 | $2,562 | $191,900 | $101,300 | $90,600 |
| 2020 | $2,453 | $175,200 | $93,800 | $81,400 |
| 2019 | $2,348 | $164,200 | $88,500 | $75,700 |
| 2018 | $2,238 | $148,700 | $78,600 | $70,100 |
| 2017 | $2,153 | $144,000 | $77,100 | $66,900 |
| 2016 | $2,106 | $133,300 | $71,400 | $61,900 |
| 2015 | $2,065 | $122,900 | $67,800 | $55,100 |
| 2014 | -- | $122,900 | $67,800 | $55,100 |
| 2013 | $2,005 | $126,500 | $67,800 | $58,700 |
Source: Public Records
Map
Nearby Homes
- 15 Percy St
- 10 Durham Rd
- 1612 U S Route 1
- 212 Main St
- 42 Durham Rd
- 11 Orchard Hill Rd
- 304 Pownal Rd
- 8 Statler Ln
- 26 Harvest Ridge Rd Unit 24
- 1260 Us Route 1
- 15 Tinkers Way
- 143 Bragdon Rd
- 4 Harper's Trail
- 137 Durham Rd
- 0 Prout Rd
- 31 Allen Range Rd
- 162 Merrill Rd
- 31 Sequoia Dr
- 42A Wardtown Rd
- 1595 U S Route 1