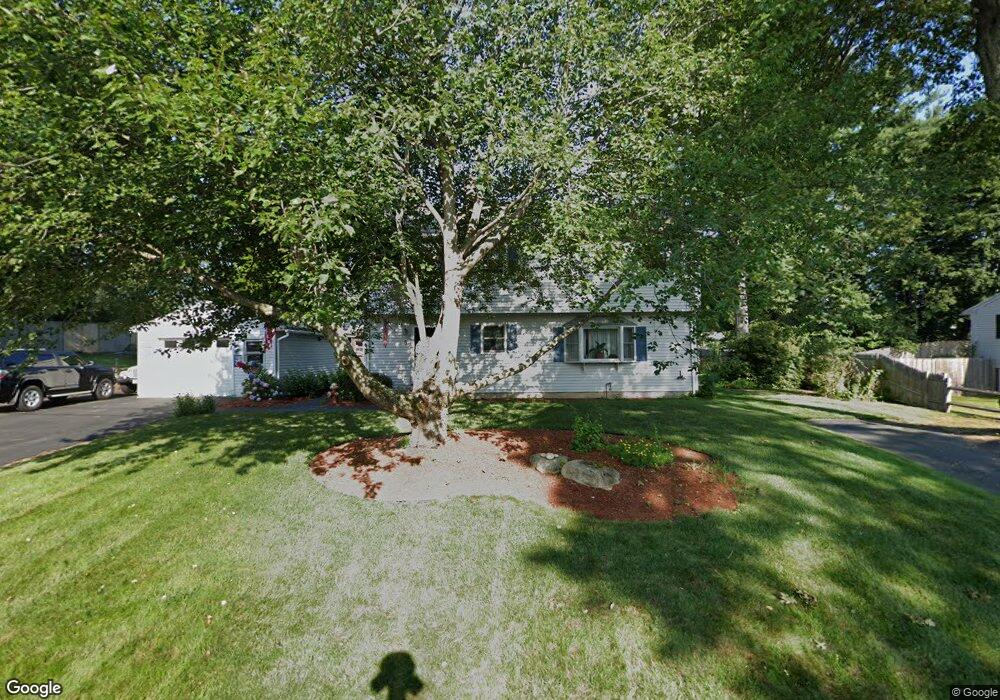
5 Halletts Way MerriMacK, NH 03054
Estimated Value: $529,109 - $562,000
3
Beds
3
Baths
2,068
Sq Ft
$264/Sq Ft
Est. Value
About This Home
This home is located at 5 Halletts Way, MerriMacK, NH 03054 and is currently estimated at $546,777, approximately $264 per square foot. 5 Halletts Way is a home located in Hillsborough County with nearby schools including James Mastricola Elementary School, James Mastricola Upper Elementary School, and Merrimack Middle School.
Ownership History
Date
Name
Owned For
Owner Type
Purchase Details
Closed on
Mar 21, 2011
Sold by
Shauna F Kimball Ret
Bought by
Hatch Howard H and Hatch Kendra V
Current Estimated Value
Home Financials for this Owner
Home Financials are based on the most recent Mortgage that was taken out on this home.
Original Mortgage
$229,640
Interest Rate
4.84%
Mortgage Type
Purchase Money Mortgage
Purchase Details
Closed on
Jan 30, 2003
Sold by
Gagnon Richard J and Gagnon Kimberly A
Bought by
Kimball Shawn K and Kimball Amy E
Home Financials for this Owner
Home Financials are based on the most recent Mortgage that was taken out on this home.
Original Mortgage
$229,500
Interest Rate
6.09%
Purchase Details
Closed on
Nov 18, 1999
Sold by
Hill Patricia L
Bought by
Gagnon Richard J and Gagnon Kimberly A
Create a Home Valuation Report for This Property
The Home Valuation Report is an in-depth analysis detailing your home's value as well as a comparison with similar homes in the area
Home Values in the Area
Average Home Value in this Area
Purchase History
| Date | Buyer | Sale Price | Title Company |
|---|---|---|---|
| Hatch Howard H | $454,700 | -- | |
| Kimball Shawn K | $229,500 | -- | |
| Gagnon Richard J | $155,000 | -- |
Source: Public Records
Mortgage History
| Date | Status | Borrower | Loan Amount |
|---|---|---|---|
| Open | Gagnon Richard J | $217,500 | |
| Closed | Gagnon Richard J | $229,640 | |
| Previous Owner | Gagnon Richard J | $20,000 | |
| Previous Owner | Gagnon Richard J | $229,500 |
Source: Public Records
Tax History Compared to Growth
Tax History
| Year | Tax Paid | Tax Assessment Tax Assessment Total Assessment is a certain percentage of the fair market value that is determined by local assessors to be the total taxable value of land and additions on the property. | Land | Improvement |
|---|---|---|---|---|
| 2024 | $7,510 | $363,000 | $174,100 | $188,900 |
| 2023 | $7,060 | $363,000 | $174,100 | $188,900 |
| 2022 | $6,309 | $363,000 | $174,100 | $188,900 |
| 2021 | $6,212 | $361,800 | $174,100 | $187,700 |
| 2020 | $6,499 | $270,100 | $124,200 | $145,900 |
| 2019 | $6,518 | $270,100 | $124,200 | $145,900 |
| 2018 | $6,515 | $270,100 | $124,200 | $145,900 |
| 2017 | $6,312 | $270,100 | $124,200 | $145,900 |
| 2016 | $6,156 | $270,100 | $124,200 | $145,900 |
| 2015 | $6,126 | $247,800 | $116,800 | $131,000 |
| 2014 | $5,970 | $247,800 | $116,800 | $131,000 |
| 2013 | $5,925 | $247,800 | $116,800 | $131,000 |
Source: Public Records
Map
Nearby Homes
- 14 Mayflower Dr
- 7 Beacon Dr
- 40 Turkey Hill Rd
- 5 Fernwood Dr
- 3 Independence Dr
- 98 Indian Rock Rd
- 8 Highland Green Ln
- 20 Jakes Ln
- 27 Sarah Dr
- 14 Silver Doe Ln
- 8 Donovan Ct
- 7 Hadley Rd
- 22 Clay St
- 40 Captain Bannon Cir
- 5 Lynn Dr
- 38 Mallard Point
- 12 Clinton Ct
- 22 Essex Green Ct
- 10 Kingston Ct Unit 10
- 11 Essex Green Ct