5 Hatch St Unit 151 Nashua, NH 03060
South End Nashua NeighborhoodEstimated Value: $442,363 - $464,000
2
Beds
1
Bath
1,203
Sq Ft
$377/Sq Ft
Est. Value
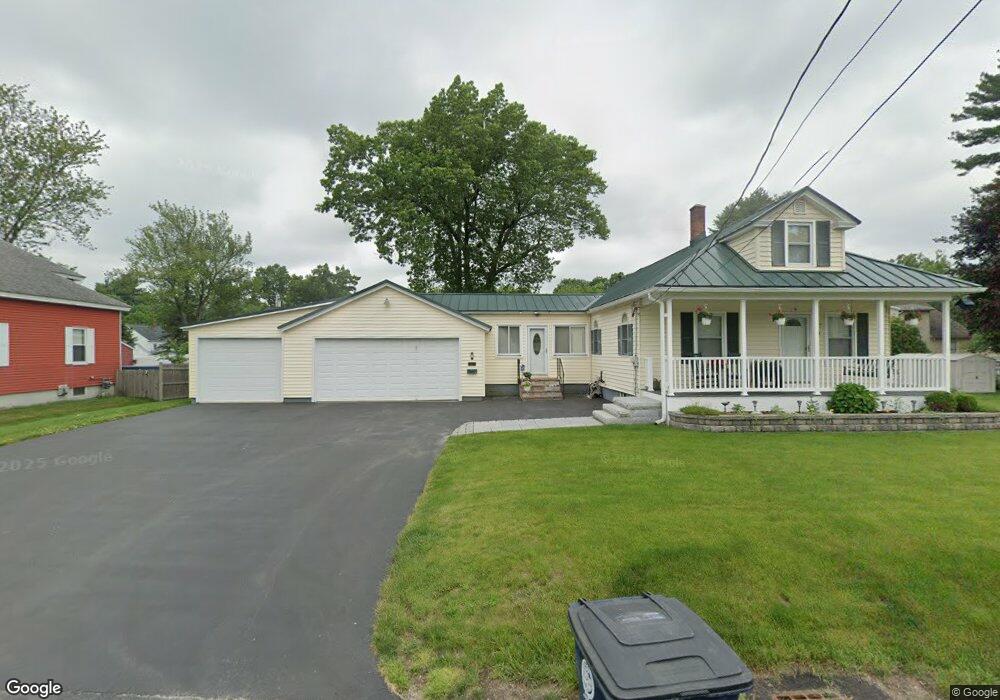
About This Home
This home is located at 5 Hatch St Unit 151, Nashua, NH 03060 and is currently estimated at $453,091, approximately $376 per square foot. 5 Hatch St Unit 151 is a home located in Hillsborough County with nearby schools including Sunset Heights Elementary School, Elm Street Middle School, and Nashua High School North.
Ownership History
Date
Name
Owned For
Owner Type
Purchase Details
Closed on
Mar 28, 2025
Sold by
Roy Nancy and Roy Richard J
Bought by
Richard and Richard Nancy Roy
Current Estimated Value
Purchase Details
Closed on
Sep 18, 1991
Bought by
Roy Nancy and Roy Richard J
Create a Home Valuation Report for This Property
The Home Valuation Report is an in-depth analysis detailing your home's value as well as a comparison with similar homes in the area
Home Values in the Area
Average Home Value in this Area
Purchase History
We collect this data history from publicly available records. To have your information removed, we recommend requesting removal directly through your county’s website.
| Date | Buyer | Sale Price | Title Company |
|---|---|---|---|
| Richard | -- | None Available | |
| Richard | -- | None Available | |
| Roy Nancy | $45,000 | -- |
Source: Public Records
Mortgage History
We collect this data history from publicly available records. To have your information removed, we recommend requesting removal directly through your county’s website.
| Date | Status | Borrower | Loan Amount |
|---|---|---|---|
| Previous Owner | Roy Nancy | $184,300 | |
| Previous Owner | Roy Nancy | $194,000 | |
| Previous Owner | Roy Nancy | $30,750 | |
| Previous Owner | Roy Nancy | $217,500 |
Source: Public Records
Tax History
| Year | Tax Paid | Tax Assessment Tax Assessment Total Assessment is a certain percentage of the fair market value that is determined by local assessors to be the total taxable value of land and additions on the property. | Land | Improvement |
|---|---|---|---|---|
| 2025 | $7,434 | $441,700 | $160,400 | $281,300 |
| 2024 | $6,826 | $429,300 | $160,400 | $268,900 |
| 2023 | $6,827 | $374,500 | $128,300 | $246,200 |
| 2022 | $6,767 | $374,500 | $128,300 | $246,200 |
| 2021 | $5,529 | $238,100 | $85,500 | $152,600 |
| 2020 | $5,383 | $238,100 | $85,500 | $152,600 |
| 2019 | $5,181 | $238,100 | $85,500 | $152,600 |
| 2018 | $5,050 | $238,100 | $85,500 | $152,600 |
| 2017 | $4,779 | $185,300 | $73,200 | $112,100 |
| 2016 | $4,645 | $185,300 | $73,200 | $112,100 |
| 2015 | $4,545 | $185,300 | $73,200 | $112,100 |
| 2014 | $4,456 | $185,300 | $73,200 | $112,100 |
Source: Public Records
Map
Nearby Homes
- 12 Burnett St Unit 115116
- 393 S Main St
- 29 Dickerman St Unit 97100
- 56 Timberline Dr
- 70 Spindlewick Dr
- 57 Timberline Dr
- 18 Fifield St
- 85 Taylor St
- 24 Dexter St Unit 103
- 7 Morse St
- 74 Linwood St
- 146 1/2 Chestnut St
- 15 Masefield Rd
- 57 Saint Camille St Unit 83
- 9 Oneida Cir
- 2 Freshwater Ct
- 3 Derby Cir
- 1b Balcom St
- 2 Forge Dr
- 4 Percheron Cir
Your Personal Tour Guide
Ask me questions while you tour the home.