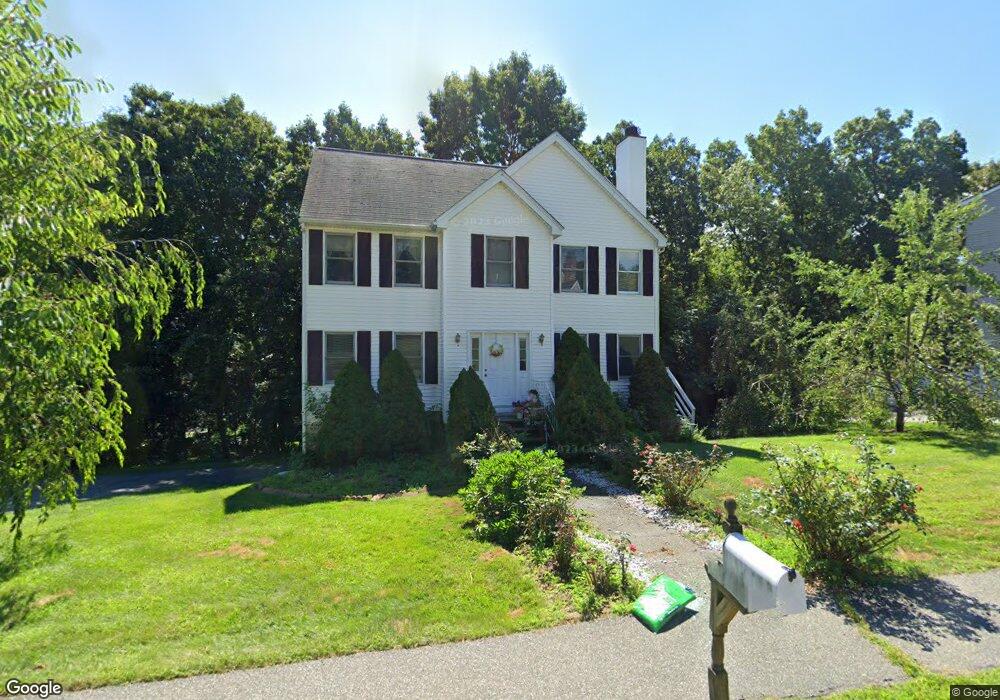
5 Hawley St Woburn, MA 01801
Downtown Woburn NeighborhoodEstimated Value: $845,000 - $925,000
3
Beds
3
Baths
1,923
Sq Ft
$465/Sq Ft
Est. Value
About This Home
This home is located at 5 Hawley St, Woburn, MA 01801 and is currently estimated at $894,941, approximately $465 per square foot. 5 Hawley St is a home located in Middlesex County with nearby schools including Shamrock Elementary School, Daniel L. Joyce Middle School, and Woburn High School.
Ownership History
Date
Name
Owned For
Owner Type
Purchase Details
Closed on
Jan 26, 1998
Sold by
Murray Joseph
Bought by
Aghazadeh-Bonab Ali and Heravi Bonab Saideh
Current Estimated Value
Home Financials for this Owner
Home Financials are based on the most recent Mortgage that was taken out on this home.
Original Mortgage
$180,800
Outstanding Balance
$32,320
Interest Rate
7.11%
Mortgage Type
Purchase Money Mortgage
Estimated Equity
$862,621
Create a Home Valuation Report for This Property
The Home Valuation Report is an in-depth analysis detailing your home's value as well as a comparison with similar homes in the area
Home Values in the Area
Average Home Value in this Area
Purchase History
| Date | Buyer | Sale Price | Title Company |
|---|---|---|---|
| Aghazadeh-Bonab Ali | $226,000 | -- |
Source: Public Records
Mortgage History
| Date | Status | Borrower | Loan Amount |
|---|---|---|---|
| Open | Aghazadeh-Bonab Ali | $180,800 |
Source: Public Records
Tax History Compared to Growth
Tax History
| Year | Tax Paid | Tax Assessment Tax Assessment Total Assessment is a certain percentage of the fair market value that is determined by local assessors to be the total taxable value of land and additions on the property. | Land | Improvement |
|---|---|---|---|---|
| 2025 | $7,060 | $826,700 | $334,600 | $492,100 |
| 2024 | $6,390 | $792,800 | $318,600 | $474,200 |
| 2023 | $6,242 | $717,500 | $289,700 | $427,800 |
| 2022 | $6,112 | $654,400 | $251,900 | $402,500 |
| 2021 | $5,876 | $629,800 | $239,900 | $389,900 |
| 2020 | $5,653 | $606,500 | $239,900 | $366,600 |
| 2019 | $5,443 | $572,900 | $228,500 | $344,400 |
| 2018 | $5,181 | $523,900 | $209,600 | $314,300 |
| 2017 | $4,812 | $484,100 | $199,700 | $284,400 |
| 2016 | $4,605 | $458,200 | $186,600 | $271,600 |
| 2015 | $4,449 | $437,500 | $174,400 | $263,100 |
| 2014 | $4,376 | $419,200 | $174,400 | $244,800 |
Source: Public Records
Map
Nearby Homes
- 3 Laurel St
- 14 Harvard Street Extension
- 51 Vernon St
- 12 Spring Ct
- 18 Gardner Ave
- 3 Frank St
- 1 Boline Place
- 117 Montvale Ave
- 27 Blueberry Hill Rd
- 69 Eastern Ave
- 39 Garfield Ave
- 64 Garfield Ave
- 18 Carmen Terrace
- 61 Mount Pleasant St
- 35 Prospect St Unit 204
- 35 Prospect St Unit 215
- 34 Union St
- 18 Central St
- 7 Prospect St
- 74 Beach St Unit 3