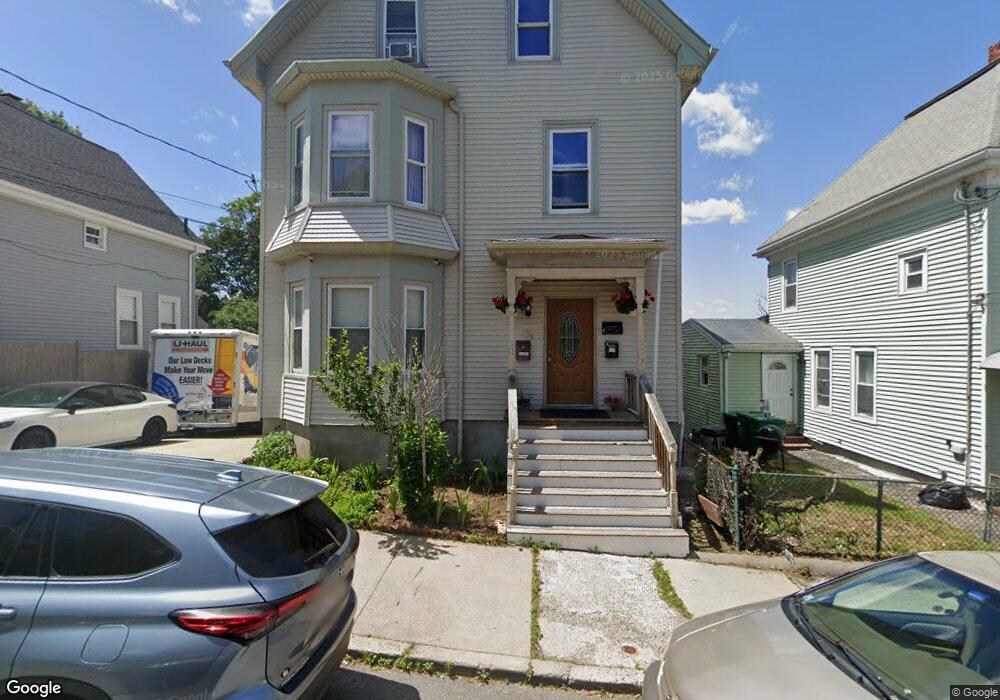
5 Hawthorne St Lynn, MA 01902
Agganis AC NeighborhoodEstimated Value: $845,471 - $866,000
7
Beds
3
Baths
3,444
Sq Ft
$247/Sq Ft
Est. Value
About This Home
This home is located at 5 Hawthorne St, Lynn, MA 01902 and is currently estimated at $851,868, approximately $247 per square foot. 5 Hawthorne St is a home located in Essex County with nearby schools including Robert L. Ford Elementary School, William R. Fallon School, and New Paths Area Learning Center.
Ownership History
Date
Name
Owned For
Owner Type
Purchase Details
Closed on
Feb 13, 2017
Sold by
Paz Jose E and Lemus Jamie
Bought by
Tejada Jose A and Tejada Noelia E
Current Estimated Value
Home Financials for this Owner
Home Financials are based on the most recent Mortgage that was taken out on this home.
Original Mortgage
$373,117
Outstanding Balance
$307,874
Interest Rate
4.25%
Mortgage Type
FHA
Estimated Equity
$543,994
Purchase Details
Closed on
Jan 12, 2004
Sold by
Stirling Eric C and Stirling Scott J
Bought by
Paz Jose E and Lemus Jaime
Home Financials for this Owner
Home Financials are based on the most recent Mortgage that was taken out on this home.
Original Mortgage
$300,300
Interest Rate
5.88%
Mortgage Type
Purchase Money Mortgage
Purchase Details
Closed on
Apr 25, 1991
Sold by
Ferguson Fred A
Bought by
Stirling Scott J
Create a Home Valuation Report for This Property
The Home Valuation Report is an in-depth analysis detailing your home's value as well as a comparison with similar homes in the area
Home Values in the Area
Average Home Value in this Area
Purchase History
| Date | Buyer | Sale Price | Title Company |
|---|---|---|---|
| Tejada Jose A | $380,000 | -- | |
| Paz Jose E | $390,000 | -- | |
| Paz Jose E | $390,000 | -- | |
| Stirling Scott J | $114,500 | -- | |
| Stirling Scott J | $114,500 | -- |
Source: Public Records
Mortgage History
| Date | Status | Borrower | Loan Amount |
|---|---|---|---|
| Open | Tejada Jose A | $373,117 | |
| Closed | Tejada Jose A | $373,117 | |
| Previous Owner | Stirling Scott J | $300,300 |
Source: Public Records
Tax History Compared to Growth
Tax History
| Year | Tax Paid | Tax Assessment Tax Assessment Total Assessment is a certain percentage of the fair market value that is determined by local assessors to be the total taxable value of land and additions on the property. | Land | Improvement |
|---|---|---|---|---|
| 2025 | $8,850 | $854,226 | $206,200 | $648,026 |
| 2024 | $8,281 | $786,400 | $186,100 | $600,300 |
| 2023 | $8,301 | $744,500 | $186,100 | $558,400 |
| 2022 | $8,339 | $670,900 | $152,200 | $518,700 |
| 2021 | $7,835 | $601,300 | $138,800 | $462,500 |
| 2020 | $6,973 | $520,400 | $108,400 | $412,000 |
| 2019 | $6,807 | $476,000 | $105,800 | $370,200 |
| 2018 | $6,286 | $414,900 | $102,200 | $312,700 |
| 2017 | $5,834 | $374,000 | $79,400 | $294,600 |
| 2016 | $5,304 | $327,800 | $66,900 | $260,900 |
| 2015 | $5,094 | $304,100 | $71,900 | $232,200 |
Source: Public Records
Map
Nearby Homes
- 325 Western Ave
- 69 Hawthorne St
- 106 Goodridge St
- 29 Ford St
- 16 Hollingsworth St
- 199 Allen Ave
- 6-8 Beede Ave
- 200 Locust St Unit 504
- 200 Locust St Unit 302
- 198 Locust St Unit 308
- 27-29 Graves Ave
- 105 Lawton Ave
- 30 Adams St
- 94 Sheridan St
- 6A Goodridge St
- 58 Laighton St
- 44 Eutaw Ave
- 14 Mount Pleasant Place
- 431-433 Chatham St
- 12 Chestnut Ave
- 9 Hawthorne St
- 1 Hawthorne St
- 13 Hawthorne St
- 17 Hawthorne St Unit 19
- 17-19 Hawthorne St
- 20 Linden Terrace
- 27 Carlton St
- 2 Hawthorne St
- 2 Hawthorne St Unit 3
- 4 Hawthorne St Unit 3
- 6 Hawthorne St
- 10 Hawthorne St
- 19 Churchill Place
- 21 Carlton St
- 26 Linden Terrace
- 16 Hawthorne St
- 17 Carlton St
- 21 Hawthorne St
- 18 Hawthorne St
- 18 Hawthorne St Unit 1