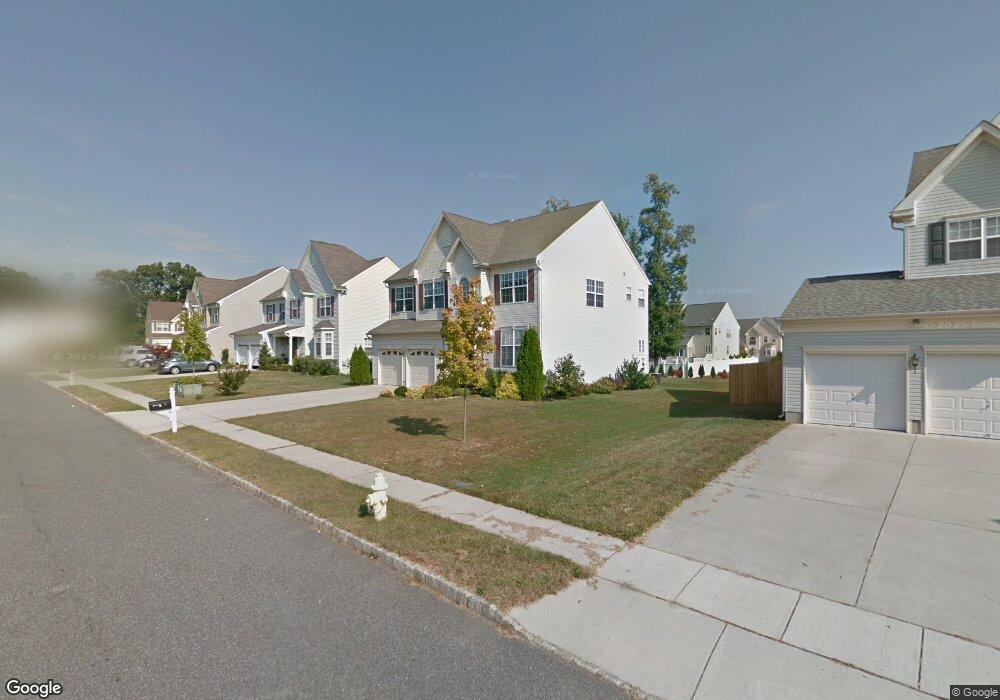
5 Hemlock Ln Sicklerville, NJ 08081
Winslow Township NeighborhoodEstimated Value: $433,309 - $514,000
--
Bed
--
Bath
2,415
Sq Ft
$198/Sq Ft
Est. Value
About This Home
This home is located at 5 Hemlock Ln, Sicklerville, NJ 08081 and is currently estimated at $478,077, approximately $197 per square foot. 5 Hemlock Ln is a home located in Camden County with nearby schools including Winslow Township High School, South Jersey Christian Academy, and St. Mary School.
Ownership History
Date
Name
Owned For
Owner Type
Purchase Details
Closed on
Jun 3, 2005
Sold by
Renaissance At Woodlands Assoc
Bought by
Lam Ben T and Truong Lan T
Current Estimated Value
Home Financials for this Owner
Home Financials are based on the most recent Mortgage that was taken out on this home.
Original Mortgage
$202,946
Outstanding Balance
$105,609
Interest Rate
5.71%
Estimated Equity
$372,468
Create a Home Valuation Report for This Property
The Home Valuation Report is an in-depth analysis detailing your home's value as well as a comparison with similar homes in the area
Home Values in the Area
Average Home Value in this Area
Purchase History
| Date | Buyer | Sale Price | Title Company |
|---|---|---|---|
| Lam Ben T | $253,683 | -- |
Source: Public Records
Mortgage History
| Date | Status | Borrower | Loan Amount |
|---|---|---|---|
| Open | Lam Ben T | $202,946 |
Source: Public Records
Tax History Compared to Growth
Tax History
| Year | Tax Paid | Tax Assessment Tax Assessment Total Assessment is a certain percentage of the fair market value that is determined by local assessors to be the total taxable value of land and additions on the property. | Land | Improvement |
|---|---|---|---|---|
| 2025 | $8,549 | $219,100 | $45,000 | $174,100 |
| 2024 | $8,324 | $219,100 | $45,000 | $174,100 |
| 2023 | $8,324 | $219,100 | $45,000 | $174,100 |
| 2022 | $8,067 | $219,100 | $45,000 | $174,100 |
| 2021 | $7,975 | $219,100 | $45,000 | $174,100 |
| 2020 | $7,905 | $219,100 | $45,000 | $174,100 |
| 2019 | $7,857 | $219,100 | $45,000 | $174,100 |
| 2018 | $7,750 | $219,100 | $45,000 | $174,100 |
| 2017 | $7,612 | $219,100 | $45,000 | $174,100 |
| 2016 | $7,515 | $219,100 | $45,000 | $174,100 |
| 2015 | $7,406 | $219,100 | $45,000 | $174,100 |
| 2014 | $7,241 | $219,100 | $45,000 | $174,100 |
Source: Public Records
Map
Nearby Homes
- 24 Lennox Ct
- 3 Linden Ct
- 23 Lennox Ct
- 9 Linden Ct
- 10 Tupelo Ln
- 18 Langdon Ct
- 9 Lawrence Ct
- 15 Lawrence Ct
- 10 Longbow Ct
- 146 Arbor Meadow Dr
- 13 Lamont Ct
- 4 Logan Ct
- 137 Arbor Meadow Dr
- 45 Aberdale Ln
- 57 Aberdale Ln
- 56 Hopewell Ln
- 88 High Meadows Dr
- 542 Williamstown Rd
- 17 Hewitt Ln
- 501 Sicklerville Rd