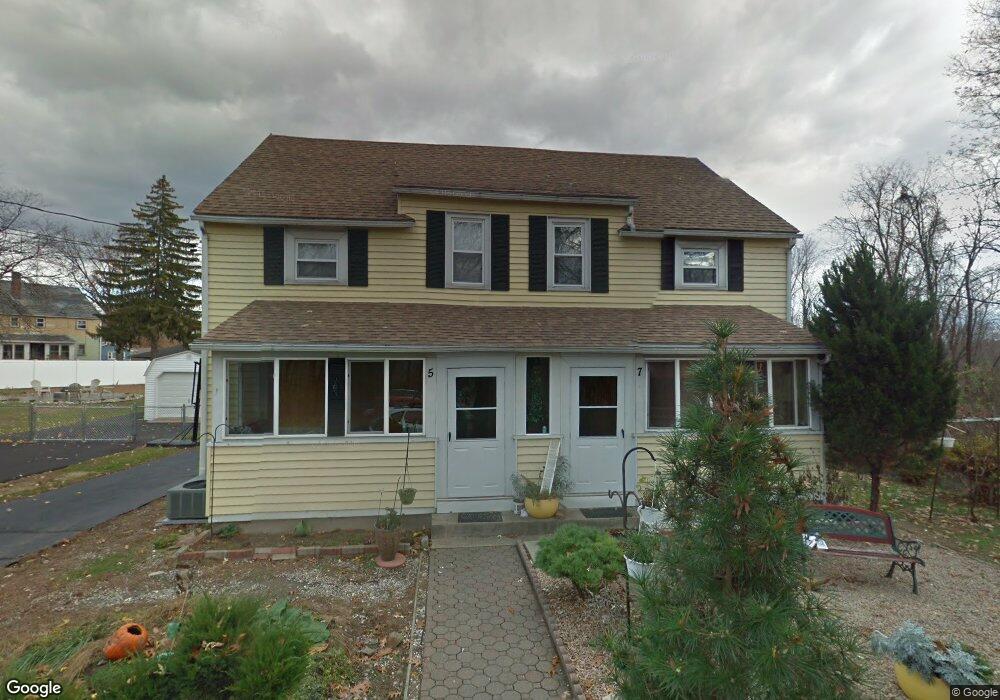
5 Hooper Rd Unit 2 Chicopee, MA 01013
Sandy Hill NeighborhoodEstimated Value: $366,290 - $402,000
2
Beds
1
Bath
1,025
Sq Ft
$370/Sq Ft
Est. Value
About This Home
This home is located at 5 Hooper Rd Unit 2, Chicopee, MA 01013 and is currently estimated at $379,573, approximately $370 per square foot. 5 Hooper Rd Unit 2 is a home located in Hampden County with nearby schools including Barry Elementary School, Bellamy Middle School, and Chicopee High School.
Ownership History
Date
Name
Owned For
Owner Type
Purchase Details
Closed on
Oct 26, 2016
Sold by
Lech Bronislaw and Lech Danuta
Bought by
Lech Danuta and Lech Bronislaw
Current Estimated Value
Purchase Details
Closed on
Dec 10, 1998
Sold by
Kozaka Theodore F and Cyboron Daniel F
Bought by
Lech Bronislaw and Lech Danuta
Home Financials for this Owner
Home Financials are based on the most recent Mortgage that was taken out on this home.
Original Mortgage
$101,800
Interest Rate
6.8%
Mortgage Type
Purchase Money Mortgage
Create a Home Valuation Report for This Property
The Home Valuation Report is an in-depth analysis detailing your home's value as well as a comparison with similar homes in the area
Home Values in the Area
Average Home Value in this Area
Purchase History
| Date | Buyer | Sale Price | Title Company |
|---|---|---|---|
| Lech Danuta | -- | -- | |
| Lech Bronislaw | $105,000 | -- |
Source: Public Records
Mortgage History
| Date | Status | Borrower | Loan Amount |
|---|---|---|---|
| Previous Owner | Lech Bronislaw | $101,800 |
Source: Public Records
Tax History Compared to Growth
Tax History
| Year | Tax Paid | Tax Assessment Tax Assessment Total Assessment is a certain percentage of the fair market value that is determined by local assessors to be the total taxable value of land and additions on the property. | Land | Improvement |
|---|---|---|---|---|
| 2025 | $4,684 | $309,000 | $116,400 | $192,600 |
| 2024 | $4,376 | $296,500 | $114,200 | $182,300 |
| 2023 | $4,044 | $266,900 | $103,800 | $163,100 |
| 2022 | $3,877 | $228,200 | $90,200 | $138,000 |
| 2021 | $3,668 | $208,300 | $82,100 | $126,200 |
| 2020 | $3,548 | $203,200 | $84,300 | $118,900 |
| 2019 | $3,544 | $197,300 | $84,300 | $113,000 |
| 2018 | $3,397 | $185,500 | $80,200 | $105,300 |
| 2017 | $3,079 | $177,900 | $73,500 | $104,400 |
| 2016 | $2,892 | $171,000 | $73,500 | $97,500 |
| 2015 | $3,033 | $172,900 | $73,500 | $99,400 |
| 2014 | $2,855 | $172,900 | $73,500 | $99,400 |
Source: Public Records
Map
Nearby Homes