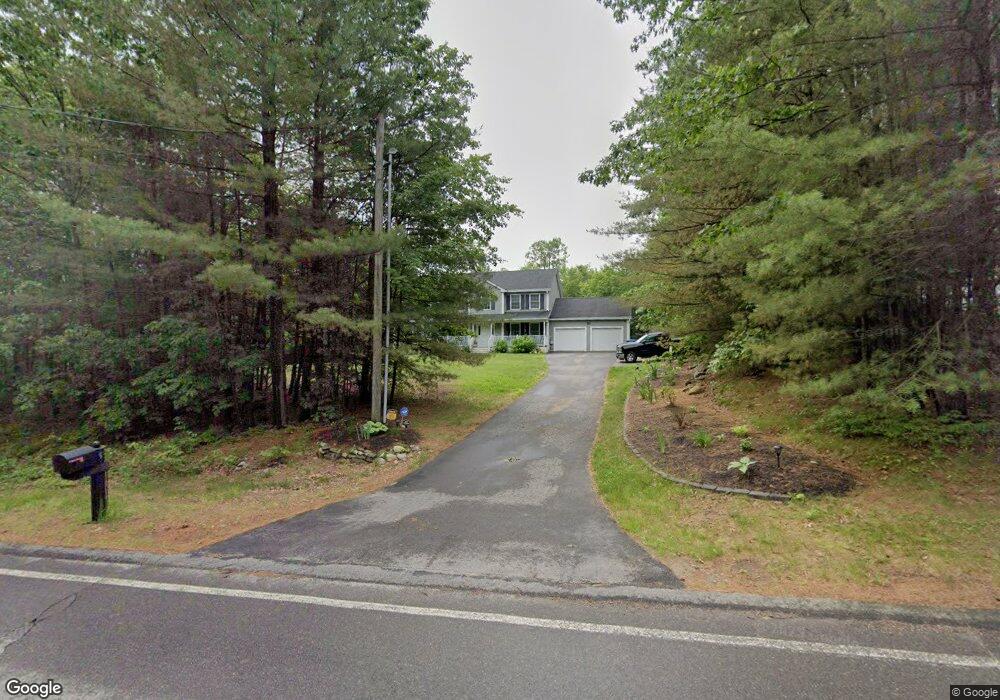
5 Hovey Rd Londonderry, NH 03053
Estimated Value: $626,000 - $764,000
4
Beds
3
Baths
2,372
Sq Ft
$301/Sq Ft
Est. Value
About This Home
This home is located at 5 Hovey Rd, Londonderry, NH 03053 and is currently estimated at $714,139, approximately $301 per square foot. 5 Hovey Rd is a home located in Rockingham County with nearby schools including Matthew Thornton Elementary School, Londonderry Middle School, and Londonderry Senior High School.
Ownership History
Date
Name
Owned For
Owner Type
Purchase Details
Closed on
Jul 6, 2016
Sold by
Tsung Malcolm M and Tsung Jennifer L
Bought by
Stymiest Darrell and Stymiest Iris Z
Current Estimated Value
Home Financials for this Owner
Home Financials are based on the most recent Mortgage that was taken out on this home.
Original Mortgage
$359,100
Outstanding Balance
$287,223
Interest Rate
3.64%
Mortgage Type
Purchase Money Mortgage
Estimated Equity
$426,916
Purchase Details
Closed on
Aug 1, 2012
Sold by
Onyx Dev Inc
Bought by
Tsung Malcolm M and Tsung Jennifer L
Purchase Details
Closed on
Mar 19, 2007
Sold by
Dunn Christopher
Bought by
Stoddard John
Home Financials for this Owner
Home Financials are based on the most recent Mortgage that was taken out on this home.
Original Mortgage
$343,200
Interest Rate
6.4%
Create a Home Valuation Report for This Property
The Home Valuation Report is an in-depth analysis detailing your home's value as well as a comparison with similar homes in the area
Home Values in the Area
Average Home Value in this Area
Purchase History
| Date | Buyer | Sale Price | Title Company |
|---|---|---|---|
| Stymiest Darrell | $265,666 | -- | |
| Stymiest Darrell | $265,666 | -- | |
| Tsung Malcolm M | $350,000 | -- | |
| Tsung Malcolm M | $350,000 | -- | |
| Stoddard John | $164,900 | -- | |
| Stoddard John | $164,900 | -- |
Source: Public Records
Mortgage History
| Date | Status | Borrower | Loan Amount |
|---|---|---|---|
| Open | Stymiest Darrell | $359,100 | |
| Closed | Stymiest Darrell | $359,100 | |
| Previous Owner | Stoddard John | $343,200 | |
| Closed | Stoddard John | $0 |
Source: Public Records
Tax History Compared to Growth
Tax History
| Year | Tax Paid | Tax Assessment Tax Assessment Total Assessment is a certain percentage of the fair market value that is determined by local assessors to be the total taxable value of land and additions on the property. | Land | Improvement |
|---|---|---|---|---|
| 2024 | $10,717 | $664,000 | $246,700 | $417,300 |
| 2023 | $10,392 | $664,000 | $246,700 | $417,300 |
| 2022 | $9,763 | $528,300 | $185,200 | $343,100 |
| 2021 | $9,651 | $525,100 | $185,200 | $339,900 |
| 2020 | $9,245 | $459,700 | $148,800 | $310,900 |
| 2019 | $8,914 | $459,700 | $148,800 | $310,900 |
| 2018 | $8,249 | $378,400 | $124,900 | $253,500 |
| 2017 | $8,177 | $378,400 | $124,900 | $253,500 |
| 2016 | $8,136 | $378,400 | $124,900 | $253,500 |
| 2015 | $7,954 | $378,400 | $124,900 | $253,500 |
| 2014 | $7,980 | $378,400 | $124,900 | $253,500 |
| 2011 | -- | $124,900 | $124,900 | $0 |
Source: Public Records
Map
Nearby Homes
- 29 Beacon St
- 17 1/2 Beacon St
- 24 Jefferson St
- 38 High St
- 20 Wedgewood Dr
- 36 Stonegate Ln
- 9 Stonegate Ln
- 71 N High St Unit 10
- 29 Fordway St
- 9 King John Dr
- 272 Winding Pond Rd Unit 272
- 50 Franklin St
- 1 Elise Ave Unit Lot 96
- 10 Elise Ave Unit 5
- 10 Elise Ave Unit Lot 5
- 7 Elise Ave Unit Lot 93
- 6 Elise Ave Unit 3
- 6 Elise Ave Unit Lot 3
- 9 Elise Ave Unit Lot 92
- 8 Elise Ave Unit Lot 4