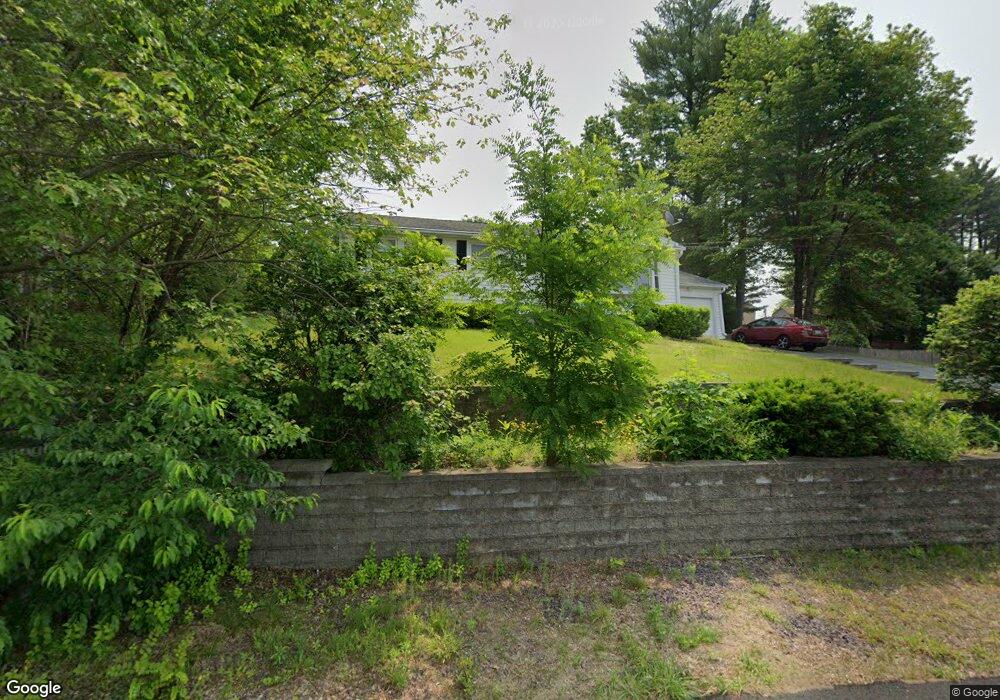
5 Jalbert Dr Nashua, NH 03060
South End Nashua NeighborhoodEstimated Value: $471,000 - $550,036
4
Beds
2
Baths
1,344
Sq Ft
$382/Sq Ft
Est. Value
About This Home
This home is located at 5 Jalbert Dr, Nashua, NH 03060 and is currently estimated at $513,009, approximately $381 per square foot. 5 Jalbert Dr is a home located in Hillsborough County with nearby schools including Fairgrounds Elementary School, Fairgrounds Middle School, and Nashua High School South.
Ownership History
Date
Name
Owned For
Owner Type
Purchase Details
Closed on
Aug 9, 2002
Sold by
Campos Fernando L and Campos Rosa
Bought by
Savoie Paul J and Savoie Joanne M
Current Estimated Value
Home Financials for this Owner
Home Financials are based on the most recent Mortgage that was taken out on this home.
Original Mortgage
$183,920
Interest Rate
6.58%
Mortgage Type
Purchase Money Mortgage
Create a Home Valuation Report for This Property
The Home Valuation Report is an in-depth analysis detailing your home's value as well as a comparison with similar homes in the area
Home Values in the Area
Average Home Value in this Area
Purchase History
| Date | Buyer | Sale Price | Title Company |
|---|---|---|---|
| Savoie Paul J | $229,900 | -- |
Source: Public Records
Mortgage History
| Date | Status | Borrower | Loan Amount |
|---|---|---|---|
| Open | Savoie Paul J | $223,850 | |
| Closed | Savoie Paul J | $65,500 | |
| Closed | Savoie Paul J | $183,920 |
Source: Public Records
Tax History
| Year | Tax Paid | Tax Assessment Tax Assessment Total Assessment is a certain percentage of the fair market value that is determined by local assessors to be the total taxable value of land and additions on the property. | Land | Improvement |
|---|---|---|---|---|
| 2025 | $8,391 | $498,600 | $168,900 | $329,700 |
| 2024 | $7,928 | $498,600 | $168,900 | $329,700 |
| 2023 | $7,620 | $418,000 | $135,100 | $282,900 |
| 2022 | $7,553 | $418,000 | $135,100 | $282,900 |
| 2021 | $6,917 | $297,900 | $90,100 | $207,800 |
| 2020 | $6,736 | $297,900 | $90,100 | $207,800 |
| 2019 | $20,215 | $297,900 | $90,100 | $207,800 |
| 2018 | $19,683 | $297,900 | $90,100 | $207,800 |
| 2017 | $10,170 | $220,200 | $69,800 | $150,400 |
| 2016 | $19,234 | $220,200 | $69,800 | $150,400 |
| 2015 | $5,402 | $220,200 | $69,800 | $150,400 |
| 2014 | $5,296 | $220,200 | $69,800 | $150,400 |
Source: Public Records
Map
Nearby Homes
- 25 Kern Dr Unit 25
- 22 Kern Dr
- 33 Ferson St
- 72 Linwood St
- 32 Fairview Ave
- 4 Henry David Dr Unit 103
- 4 Henry David Dr Unit 203
- 4 Nightingale Rd
- 25 E Dunstable Rd
- 2 Henry David Dr Unit 207
- 17 1/2 Balcom St
- 20 Nightingale Rd
- 6 Hayden St
- 2 Doncaster Dr
- 8 Collier Ct
- 23 Eastman St
- 22 Taschereau Blvd
- 397 S Main St
- 1 Thompson Rd Unit 109
- 169A W Hollis St Unit 193
Your Personal Tour Guide
Ask me questions while you tour the home.