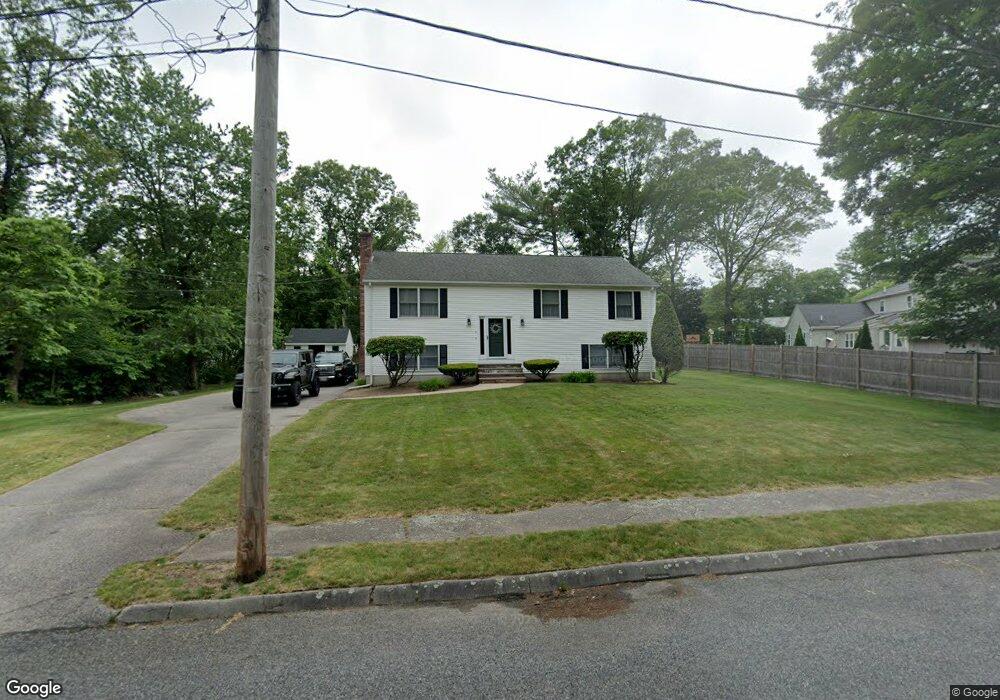
5 Janet Ln Mansfield, MA 02048
Estimated Value: $650,512 - $829,000
4
Beds
3
Baths
1,288
Sq Ft
$554/Sq Ft
Est. Value
About This Home
This home is located at 5 Janet Ln, Mansfield, MA 02048 and is currently estimated at $714,128, approximately $554 per square foot. 5 Janet Ln is a home located in Bristol County with nearby schools including Everett W. Robinson Elementary School, Jordan/Jackson Elementary School, and Harold L. Qualters Middle School.
Ownership History
Date
Name
Owned For
Owner Type
Purchase Details
Closed on
Jul 28, 1995
Sold by
Dorren Janet A and Nugent Agnes J
Bought by
Murray Robert J and Murray Balestra-Murray C
Current Estimated Value
Home Financials for this Owner
Home Financials are based on the most recent Mortgage that was taken out on this home.
Original Mortgage
$187,650
Interest Rate
7.56%
Mortgage Type
Purchase Money Mortgage
Create a Home Valuation Report for This Property
The Home Valuation Report is an in-depth analysis detailing your home's value as well as a comparison with similar homes in the area
Home Values in the Area
Average Home Value in this Area
Purchase History
| Date | Buyer | Sale Price | Title Company |
|---|---|---|---|
| Murray Robert J | $208,500 | -- |
Source: Public Records
Mortgage History
| Date | Status | Borrower | Loan Amount |
|---|---|---|---|
| Open | Murray Robert J | $230,000 | |
| Closed | Murray Robert J | $187,650 | |
| Previous Owner | Murray Robert J | $58,375 | |
| Previous Owner | Murray Robert J | $51,000 |
Source: Public Records
Tax History
| Year | Tax Paid | Tax Assessment Tax Assessment Total Assessment is a certain percentage of the fair market value that is determined by local assessors to be the total taxable value of land and additions on the property. | Land | Improvement |
|---|---|---|---|---|
| 2025 | $8,205 | $623,000 | $254,000 | $369,000 |
| 2024 | $7,540 | $558,500 | $242,500 | $316,000 |
| 2023 | $7,314 | $519,100 | $242,500 | $276,600 |
| 2022 | $7,040 | $464,100 | $224,400 | $239,700 |
| 2021 | $4,813 | $464,100 | $213,800 | $250,300 |
| 2020 | $3,607 | $443,800 | $187,100 | $256,700 |
| 2019 | $3,520 | $434,800 | $178,100 | $256,700 |
| 2018 | $4,078 | $407,200 | $169,700 | $237,500 |
| 2017 | $3,026 | $406,500 | $164,700 | $241,800 |
| 2016 | $6,044 | $392,200 | $156,800 | $235,400 |
| 2015 | $5,583 | $360,200 | $156,800 | $203,400 |
Source: Public Records
Map
Nearby Homes
- 14 Claire Ave
- 2 Oak St Unit 2B
- 451R Gilbert St
- 150 Gilbert St
- 250 Mansfield Ave Unit 11
- 128 Tremont St
- 71 Richardson Ave
- 343 Godfrey Dr
- 143 Oak St Unit 10
- 49 Pheasant Hill Rd
- 24 Maverick Dr
- 10 Walter St
- 157 Mansfield Ave Unit 27
- 157 Mansfield Ave Unit 14
- 1769 West St
- 19 Barberry Rd
- 345 Richardson Ave
- 5 Village Way Unit C
- 16 Holly Rd
- 20 John F. Kennedy Dr
Your Personal Tour Guide
Ask me questions while you tour the home.