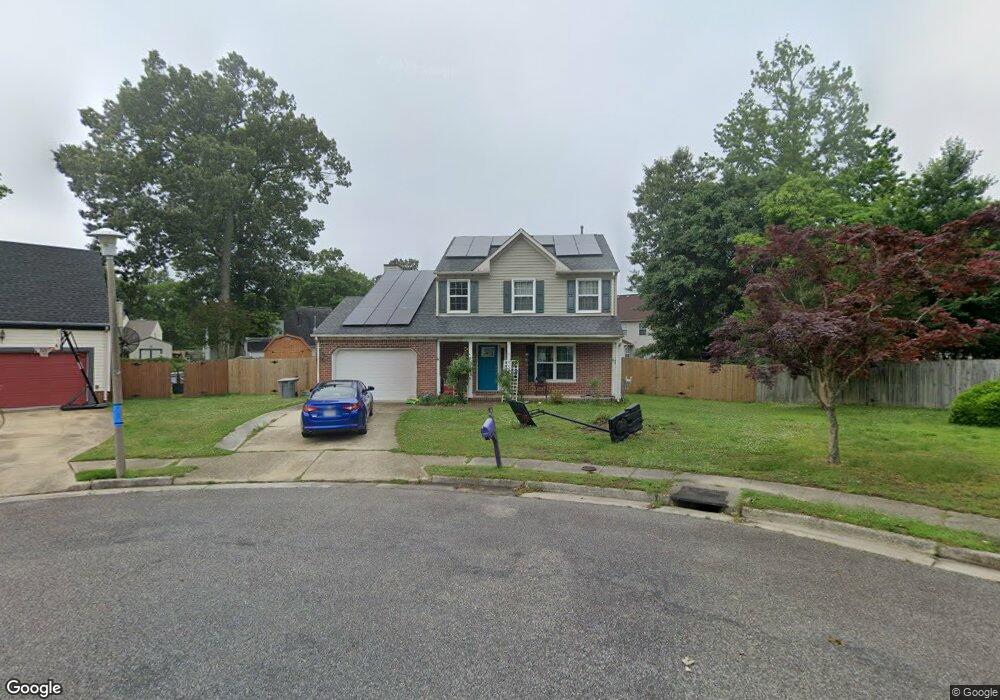
5 Janice Ct Hampton, VA 23666
Northampton NeighborhoodEstimated Value: $393,000 - $430,000
4
Beds
3
Baths
2,224
Sq Ft
$185/Sq Ft
Est. Value
About This Home
This home is located at 5 Janice Ct, Hampton, VA 23666 and is currently estimated at $411,472, approximately $185 per square foot. 5 Janice Ct is a home located in Hampton City with nearby schools including George P. Phenix Elementary School, Cesar Tarrant Middle School, and Bethel High School.
Ownership History
Date
Name
Owned For
Owner Type
Purchase Details
Closed on
Dec 9, 2015
Sold by
The Secretary Of Veterans Affairs
Bought by
Brinkley Myron G
Current Estimated Value
Home Financials for this Owner
Home Financials are based on the most recent Mortgage that was taken out on this home.
Original Mortgage
$205,840
Outstanding Balance
$166,121
Interest Rate
4.5%
Mortgage Type
FHA
Estimated Equity
$245,351
Purchase Details
Closed on
Jul 22, 2015
Sold by
Samuel I White Pc Sub Tr
Bought by
Secretary Of Veterans Affairs
Purchase Details
Closed on
Aug 13, 2008
Sold by
T & J Of Va L L C
Bought by
Cox Vikki A
Home Financials for this Owner
Home Financials are based on the most recent Mortgage that was taken out on this home.
Original Mortgage
$269,900
Interest Rate
6.4%
Mortgage Type
VA
Create a Home Valuation Report for This Property
The Home Valuation Report is an in-depth analysis detailing your home's value as well as a comparison with similar homes in the area
Home Values in the Area
Average Home Value in this Area
Purchase History
| Date | Buyer | Sale Price | Title Company |
|---|---|---|---|
| Brinkley Myron G | $205,500 | Title Company Inc | |
| Secretary Of Veterans Affairs | $199,868 | None Available | |
| Cox Vikki A | $269,900 | -- |
Source: Public Records
Mortgage History
| Date | Status | Borrower | Loan Amount |
|---|---|---|---|
| Open | Brinkley Myron G | $205,840 | |
| Previous Owner | Cox Vikki A | $269,900 |
Source: Public Records
Tax History
| Year | Tax Paid | Tax Assessment Tax Assessment Total Assessment is a certain percentage of the fair market value that is determined by local assessors to be the total taxable value of land and additions on the property. | Land | Improvement |
|---|---|---|---|---|
| 2025 | $4,342 | $379,300 | $85,000 | $294,300 |
| 2024 | $4,064 | $353,400 | $85,000 | $268,400 |
| 2023 | $4,046 | $348,800 | $85,000 | $263,800 |
| 2022 | $3,649 | $309,200 | $80,000 | $229,200 |
| 2021 | $3,435 | $266,500 | $75,000 | $191,500 |
| 2020 | $3,233 | $260,700 | $75,000 | $185,700 |
| 2019 | $3,208 | $258,700 | $75,000 | $183,700 |
| 2018 | $3,170 | $244,200 | $75,000 | $169,200 |
| 2017 | $3,122 | $0 | $0 | $0 |
| 2016 | $3,122 | $244,200 | $0 | $0 |
| 2015 | $3,051 | $0 | $0 | $0 |
| 2014 | $2,973 | $233,000 | $75,000 | $158,000 |
Source: Public Records
Map
Nearby Homes
- 5 Beaver Castle Ct
- 9 Ancel Ct
- 40 Pelchat Dr
- 47 Pelchat Dr
- 41 Pelchat Dr
- 85 Haviland Dr
- 719 Michelle Dr
- 9 Kenilworth Dr
- 9 Fallmeadow Ct
- 708 Dresden Dr
- 737 Michelle Dr
- 326 Manning Ln
- 39 Edenbrook Dr
- 691 Dresden Dr
- 317 Manning Ln
- 335 Manning Ln
- 114 Henry Clay Rd
- 14 Post Oak Ct
- 212 Birman Wood Dr
- 7 Mary Ann Dr
Your Personal Tour Guide
Ask me questions while you tour the home.