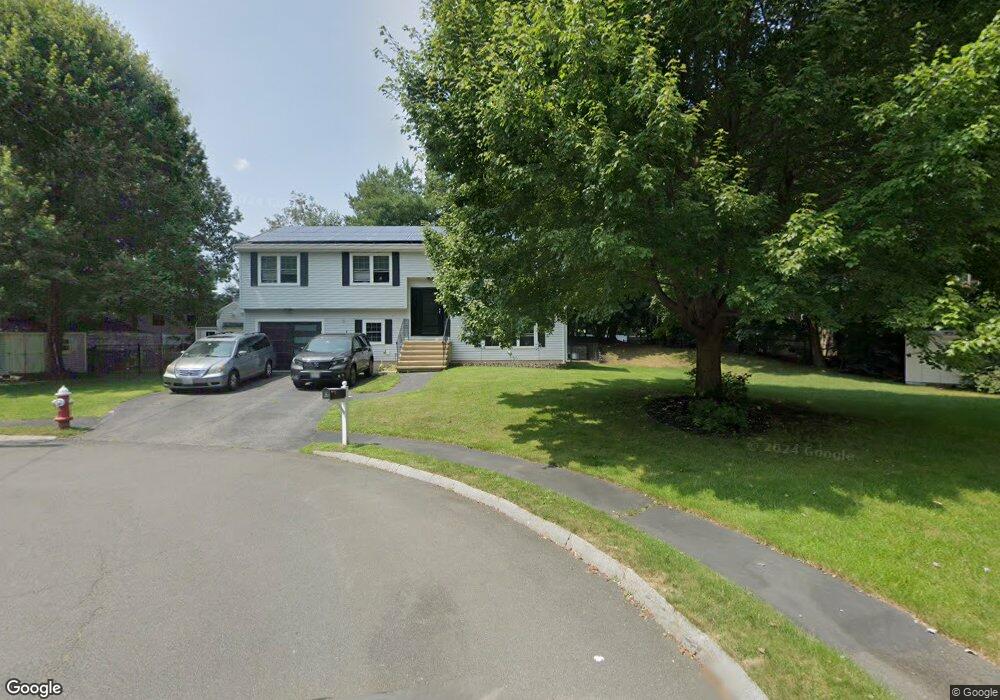
5 Jillian Cir Woburn, MA 01801
North Woburn NeighborhoodEstimated Value: $610,000 - $1,004,000
3
Beds
3
Baths
1,276
Sq Ft
$646/Sq Ft
Est. Value
About This Home
This home is located at 5 Jillian Cir, Woburn, MA 01801 and is currently estimated at $824,079, approximately $645 per square foot. 5 Jillian Cir is a home located in Middlesex County with nearby schools including Linscott-Rumford Elementary School, John F. Kennedy Middle School, and Woburn High School.
Ownership History
Date
Name
Owned For
Owner Type
Purchase Details
Closed on
Jan 29, 2008
Sold by
Pillivant Judith A and Pizzo Judith A
Bought by
Garrett John M and Garrett Lisa J
Current Estimated Value
Purchase Details
Closed on
May 30, 1997
Sold by
Malek Dolores and Malek Diane
Bought by
Pillivant Judith A and Garrett John M
Home Financials for this Owner
Home Financials are based on the most recent Mortgage that was taken out on this home.
Original Mortgage
$172,000
Interest Rate
8.09%
Mortgage Type
Purchase Money Mortgage
Purchase Details
Closed on
Sep 11, 1995
Sold by
Park Hill Rt and Murray
Bought by
Malek Dolores and Malek Diane
Home Financials for this Owner
Home Financials are based on the most recent Mortgage that was taken out on this home.
Original Mortgage
$164,000
Interest Rate
7.8%
Mortgage Type
Purchase Money Mortgage
Create a Home Valuation Report for This Property
The Home Valuation Report is an in-depth analysis detailing your home's value as well as a comparison with similar homes in the area
Home Values in the Area
Average Home Value in this Area
Purchase History
| Date | Buyer | Sale Price | Title Company |
|---|---|---|---|
| Garrett John M | -- | -- | |
| Garrett John M | -- | -- | |
| Pillivant Judith A | $215,000 | -- | |
| Malek Dolores | $205,000 | -- |
Source: Public Records
Mortgage History
| Date | Status | Borrower | Loan Amount |
|---|---|---|---|
| Open | Malek Dolores | $156,000 | |
| Previous Owner | Malek Dolores | $172,000 | |
| Previous Owner | Malek Dolores | $164,000 |
Source: Public Records
Tax History Compared to Growth
Tax History
| Year | Tax Paid | Tax Assessment Tax Assessment Total Assessment is a certain percentage of the fair market value that is determined by local assessors to be the total taxable value of land and additions on the property. | Land | Improvement |
|---|---|---|---|---|
| 2025 | $7,096 | $830,900 | $368,000 | $462,900 |
| 2024 | $6,556 | $813,400 | $350,500 | $462,900 |
| 2023 | $6,334 | $728,100 | $318,600 | $409,500 |
| 2022 | $6,151 | $658,600 | $277,100 | $381,500 |
| 2021 | $6,365 | $630,300 | $263,900 | $366,400 |
| 2020 | $5,653 | $606,500 | $263,900 | $342,600 |
| 2019 | $6,001 | $561,500 | $251,300 | $310,200 |
| 2018 | $5,100 | $515,700 | $230,600 | $285,100 |
| 2017 | $5,514 | $493,900 | $219,600 | $274,300 |
| 2016 | $4,688 | $466,500 | $205,300 | $261,200 |
| 2015 | $4,518 | $444,200 | $191,800 | $252,400 |
| 2014 | $4,298 | $411,700 | $191,800 | $219,900 |
Source: Public Records
Map
Nearby Homes
- 26 E Dexter Ave
- 104 Forest Park Rd
- 28 Van Norden Rd
- 6R & 6 Tidd Ave
- 6 Tidd Ave
- 6 Callahan Dr
- 23 Ward St Unit A
- 16 Sunnyside Rd
- 6 Kendal Dr
- 3 Highet Ave
- 0 Fryeburg Rd
- 38 Middle St
- 82 Lowell St
- 16 Taylor Dr Unit 1010
- 16 Taylor Dr Unit 1009
- 48 Mishawum Rd
- 8 Clinton St
- 3 Hart St
- 16 Munroe Ave
- 2 Inwood Dr Unit 1010
- 4 Jillian Cir
- 3 Jillian Cir
- 65 Merrimac St
- 63 Merrimac St Unit B
- 63 Merrimac St
- 2 3rd Rd Unit B
- 2 3rd Rd Unit 6
- 2 3rd Rd Unit 4
- 2 3rd Rd Unit A
- 67 Merrimac St
- 2 Poplar St
- 62 Merrimac St
- 72 Merrimac St
- 72 Merrimac St Unit Rear
- 74 Merrimac St
- 71 Merrimac St
- 6 Cottage St
- 45 Merrimac St Unit 22
- 45 Merrimac St Unit 25
- 45 Merrimac St Unit 7 aka 15A