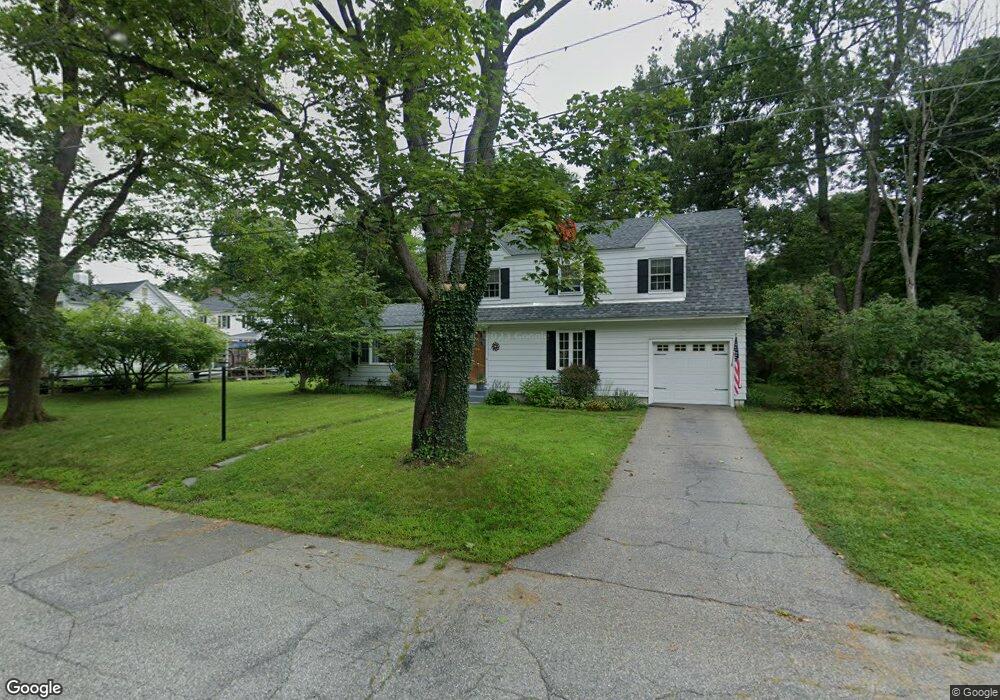
5 Jordan Ave Concord, NH 03301
South End NeighborhoodEstimated Value: $516,823 - $636,000
3
Beds
2
Baths
1,933
Sq Ft
$290/Sq Ft
Est. Value
About This Home
This home is located at 5 Jordan Ave, Concord, NH 03301 and is currently estimated at $560,456, approximately $289 per square foot. 5 Jordan Ave is a home located in Merrimack County with nearby schools including Abbot-Downing School, Rundlett Middle School, and Concord High School.
Ownership History
Date
Name
Owned For
Owner Type
Purchase Details
Closed on
Apr 25, 2024
Sold by
Whitson Craig T
Bought by
Whitson Abigail S
Current Estimated Value
Purchase Details
Closed on
Nov 22, 2005
Sold by
Arun Kilara T
Bought by
Whitson Craig T and Whitson Abigail S
Home Financials for this Owner
Home Financials are based on the most recent Mortgage that was taken out on this home.
Original Mortgage
$210,000
Interest Rate
6.07%
Mortgage Type
Purchase Money Mortgage
Purchase Details
Closed on
Apr 5, 2004
Sold by
Vera W Munson T
Bought by
Kilara Arun and Kilara Karen E
Create a Home Valuation Report for This Property
The Home Valuation Report is an in-depth analysis detailing your home's value as well as a comparison with similar homes in the area
Home Values in the Area
Average Home Value in this Area
Purchase History
| Date | Buyer | Sale Price | Title Company |
|---|---|---|---|
| Whitson Abigail S | -- | None Available | |
| Whitson Abigail S | -- | None Available | |
| Whitson Craig T | $293,000 | -- | |
| Whitson Craig T | $293,000 | -- | |
| Whitson Craig T | $293,000 | -- | |
| Kilara Arun | $260,000 | -- | |
| Kilara Arun | $260,000 | -- |
Source: Public Records
Mortgage History
| Date | Status | Borrower | Loan Amount |
|---|---|---|---|
| Previous Owner | Kilara Arun | $201,000 | |
| Previous Owner | Kilara Arun | $20,500 | |
| Previous Owner | Whitson Craig T | $210,000 |
Source: Public Records
Tax History
| Year | Tax Paid | Tax Assessment Tax Assessment Total Assessment is a certain percentage of the fair market value that is determined by local assessors to be the total taxable value of land and additions on the property. | Land | Improvement |
|---|---|---|---|---|
| 2025 | $9,941 | $341,500 | $120,600 | $220,900 |
| 2024 | $9,456 | $341,500 | $120,600 | $220,900 |
| 2023 | $9,173 | $341,500 | $120,600 | $220,900 |
| 2022 | $8,841 | $341,500 | $120,600 | $220,900 |
| 2021 | $8,634 | $343,700 | $120,600 | $223,100 |
| 2020 | $8,411 | $314,300 | $94,900 | $219,400 |
| 2019 | $7,953 | $286,300 | $98,600 | $187,700 |
| 2018 | $7,755 | $275,100 | $99,000 | $176,100 |
| 2017 | $7,614 | $269,600 | $99,000 | $170,600 |
| 2016 | $7,236 | $261,500 | $97,200 | $164,300 |
| 2015 | $6,805 | $248,500 | $105,300 | $143,200 |
| 2014 | $6,662 | $248,500 | $105,300 | $143,200 |
| 2013 | -- | $248,500 | $105,300 | $143,200 |
| 2012 | -- | $249,900 | $111,000 | $138,900 |
Source: Public Records
Map
Nearby Homes
- 0 South St Unit 4969509
- 33 Joffre St
- 335 S Main St
- 40 Nivelle St
- 289 South St
- 47 Noyes St
- 273-279 S Main St
- 47 South St
- 30 Longmeadow Dr
- 58 S State St
- 111 -113 South Main St
- 7-9 Myrtle St
- 25 N Spring St
- 5 Holly Cir
- 5 Windchime Dr
- 21 Fairfield Dr
- 22 Fairfield Dr
- 20 Fairfield Dr
- 4 Bow Center Rd Unit F2
- 26 Jonathan Ln
Your Personal Tour Guide
Ask me questions while you tour the home.