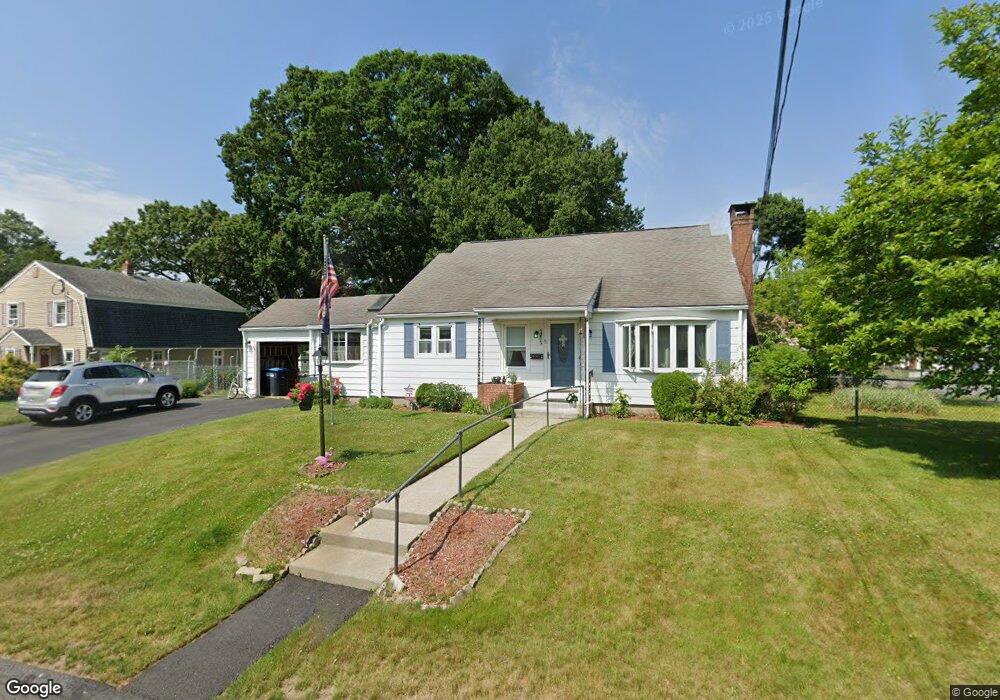
5 June St Auburn, MA 01501
Stoneville NeighborhoodEstimated Value: $481,491 - $529,000
4
Beds
3
Baths
2,086
Sq Ft
$247/Sq Ft
Est. Value
About This Home
This home is located at 5 June St, Auburn, MA 01501 and is currently estimated at $515,623, approximately $247 per square foot. 5 June St is a home located in Worcester County with nearby schools including Auburn Senior High School and Shrewsbury Montessori School - Auburn Campus.
Ownership History
Date
Name
Owned For
Owner Type
Purchase Details
Closed on
Dec 3, 1992
Sold by
Mcgoldrick Michael G and Mcgoldrick Susan
Bought by
Zukowsky Robert J and Zukowsky Carol
Current Estimated Value
Home Financials for this Owner
Home Financials are based on the most recent Mortgage that was taken out on this home.
Original Mortgage
$50,000
Interest Rate
8.22%
Mortgage Type
Purchase Money Mortgage
Create a Home Valuation Report for This Property
The Home Valuation Report is an in-depth analysis detailing your home's value as well as a comparison with similar homes in the area
Home Values in the Area
Average Home Value in this Area
Purchase History
| Date | Buyer | Sale Price | Title Company |
|---|---|---|---|
| Zukowsky Robert J | $120,000 | -- |
Source: Public Records
Mortgage History
| Date | Status | Borrower | Loan Amount |
|---|---|---|---|
| Open | Zukowsky Robert J | $52,000 | |
| Closed | Zukowsky Robert J | $20,000 | |
| Closed | Zukowsky Robert J | $50,000 | |
| Previous Owner | Zukowsky Robert J | $75,000 |
Source: Public Records
Tax History
| Year | Tax Paid | Tax Assessment Tax Assessment Total Assessment is a certain percentage of the fair market value that is determined by local assessors to be the total taxable value of land and additions on the property. | Land | Improvement |
|---|---|---|---|---|
| 2025 | $58 | $407,200 | $113,500 | $293,700 |
| 2024 | $5,997 | $401,700 | $107,700 | $294,000 |
| 2023 | $5,890 | $370,900 | $97,900 | $273,000 |
| 2022 | $5,440 | $323,400 | $97,900 | $225,500 |
| 2021 | $0 | $290,000 | $86,400 | $203,600 |
| 2020 | $0 | $282,000 | $86,400 | $195,600 |
| 2019 | $4,964 | $269,500 | $85,500 | $184,000 |
| 2018 | $0 | $262,200 | $79,900 | $182,300 |
| 2017 | $4,673 | $254,800 | $72,500 | $182,300 |
| 2016 | $4,405 | $243,500 | $75,900 | $167,600 |
| 2015 | $4,011 | $232,400 | $75,900 | $156,500 |
| 2014 | $3,914 | $226,400 | $72,300 | $154,100 |
Source: Public Records
Map
Nearby Homes
- 5 Commonwealth Ave
- 177 Boyce St
- 99 Clover St
- 25 Vinal St Unit 28
- 25 Vinal St Unit 26
- 25 Vinal St Unit 29
- 25 Vinal St Unit 30
- 1 Rockland Road Ct
- 177 Oxford St N
- 11 Hulbert Rd Unit 13
- 19-20 Williams St
- 27 Havana Rd
- 40 Bryn Mawr Ave
- 31-33 Walsh Ave
- 33 Walsh Ave
- 31 Walsh Ave
- 6 Buron Terrace
- 204-212 Hampton St
- 103 Henshaw St
- 84 Eureka St
Your Personal Tour Guide
Ask me questions while you tour the home.