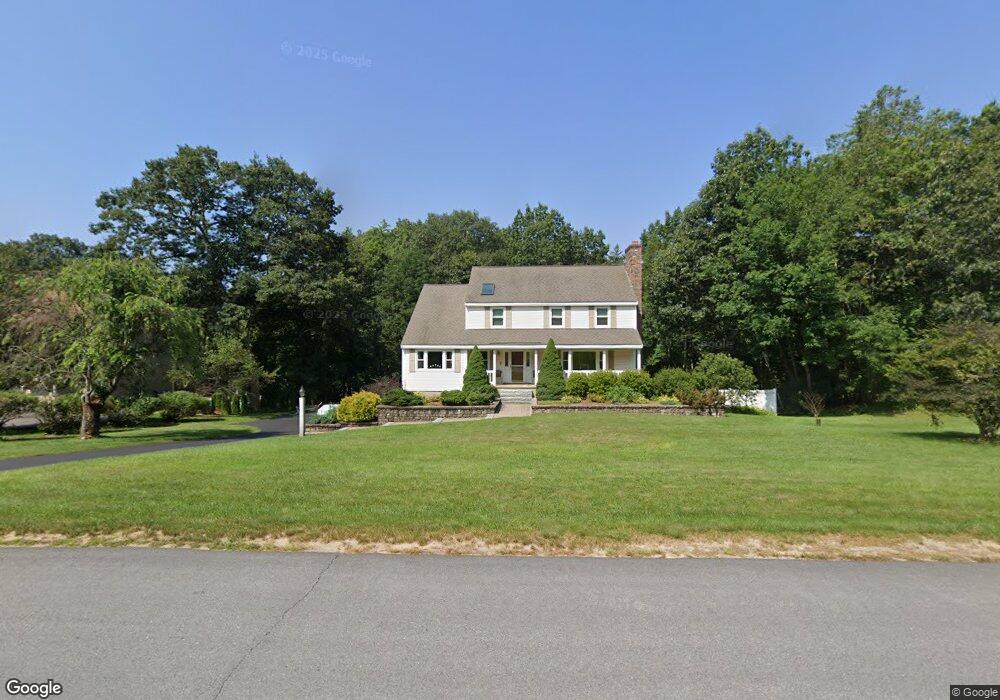
5 Kent St Windham, NH 03087
Estimated Value: $832,861 - $1,031,000
4
Beds
4
Baths
2,717
Sq Ft
$337/Sq Ft
Est. Value
About This Home
This home is located at 5 Kent St, Windham, NH 03087 and is currently estimated at $916,715, approximately $337 per square foot. 5 Kent St is a home located in Rockingham County with nearby schools including Golden Brook Elementary School, Windham Middle School, and Windham High School.
Ownership History
Date
Name
Owned For
Owner Type
Purchase Details
Closed on
Oct 31, 1997
Sold by
Boucher Joseph D R and Boucher Cheryl L
Bought by
Rousseau Jeffrey H and Rousseau Cheryl L
Current Estimated Value
Home Financials for this Owner
Home Financials are based on the most recent Mortgage that was taken out on this home.
Original Mortgage
$200,650
Interest Rate
7.31%
Create a Home Valuation Report for This Property
The Home Valuation Report is an in-depth analysis detailing your home's value as well as a comparison with similar homes in the area
Home Values in the Area
Average Home Value in this Area
Purchase History
| Date | Buyer | Sale Price | Title Company |
|---|---|---|---|
| Rousseau Jeffrey H | $267,600 | -- |
Source: Public Records
Mortgage History
| Date | Status | Borrower | Loan Amount |
|---|---|---|---|
| Open | Rousseau Jeffrey H | $191,750 | |
| Closed | Rousseau Jeffrey H | $200,650 |
Source: Public Records
Tax History
| Year | Tax Paid | Tax Assessment Tax Assessment Total Assessment is a certain percentage of the fair market value that is determined by local assessors to be the total taxable value of land and additions on the property. | Land | Improvement |
|---|---|---|---|---|
| 2024 | $11,655 | $514,800 | $200,200 | $314,600 |
| 2023 | $10,597 | $495,200 | $200,200 | $295,000 |
| 2022 | $9,785 | $495,200 | $200,200 | $295,000 |
| 2021 | $9,221 | $495,200 | $200,200 | $295,000 |
| 2020 | $9,473 | $495,200 | $200,200 | $295,000 |
| 2019 | $9,144 | $405,500 | $183,600 | $221,900 |
| 2018 | $9,558 | $410,400 | $183,600 | $226,800 |
| 2017 | $8,290 | $410,400 | $183,600 | $226,800 |
| 2016 | $8,955 | $410,400 | $183,600 | $226,800 |
| 2015 | $8,977 | $413,300 | $183,600 | $229,700 |
| 2014 | $9,259 | $385,800 | $194,000 | $191,800 |
| 2013 | $9,072 | $384,400 | $194,000 | $190,400 |
Source: Public Records
Map
Nearby Homes
- 14 Londonderry Rd
- 2 Mulberry St
- 106 N Lowell Rd
- 4 Arbor Rd
- 16 Arbor Rd
- 98 Trails Edge Rd
- 39 Overton Rd
- 5 Hidden Valley Rd
- 7 Lilac Ridge Rd
- 54 Enterprise Dr
- 16 Towne Dr
- 67 Forest St
- 6 Chadwick Cir
- 47 Cobbetts Pond Rd
- 87 Oakridge Dr
- 69 Oakridge Dr
- 47 Oakridge Dr
- 24 Rockingham Rd
- 3 Holly Ln
- 5 Elise Ave Unit Lot 94
Your Personal Tour Guide
Ask me questions while you tour the home.