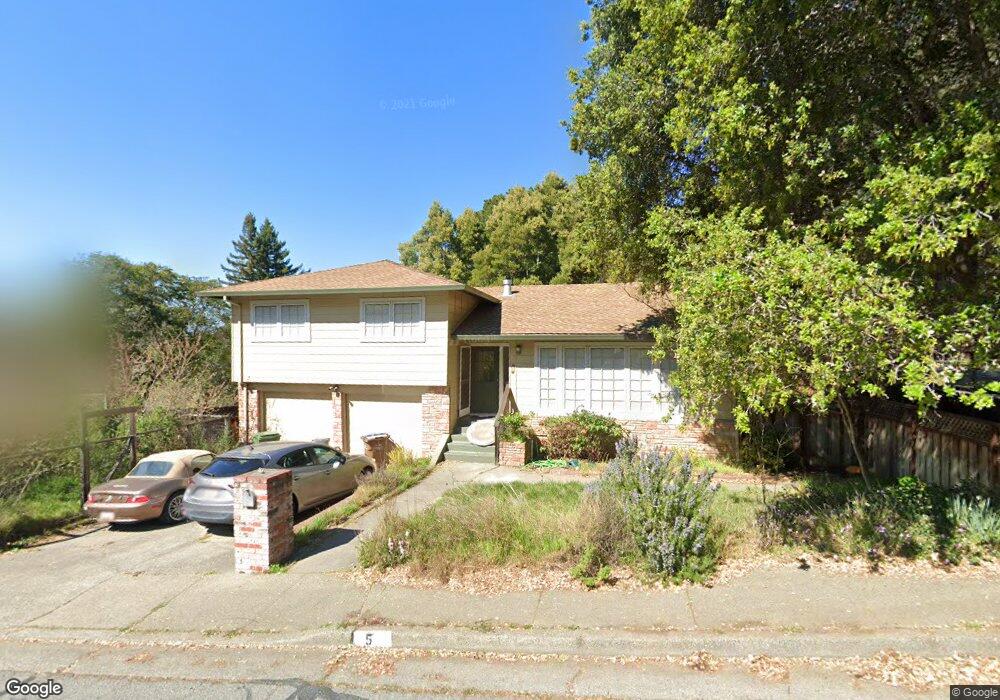
5 La Loma Ct San Rafael, CA 94901
Picnic Valley NeighborhoodEstimated Value: $1,220,000 - $1,363,000
4
Beds
2
Baths
1,840
Sq Ft
$698/Sq Ft
Est. Value
About This Home
This home is located at 5 La Loma Ct, San Rafael, CA 94901 and is currently estimated at $1,283,869, approximately $697 per square foot. 5 La Loma Ct is a home located in Marin County with nearby schools including Laurel Dell Elementary School, James B. Davidson Middle School, and San Rafael High School.
Ownership History
Date
Name
Owned For
Owner Type
Purchase Details
Closed on
Oct 21, 2020
Sold by
Ridout Joe
Bought by
Ridout Joe
Current Estimated Value
Home Financials for this Owner
Home Financials are based on the most recent Mortgage that was taken out on this home.
Original Mortgage
$373,995
Interest Rate
3%
Mortgage Type
New Conventional
Purchase Details
Closed on
Jun 29, 2017
Sold by
Ridout Amy
Bought by
Ridout Joe
Purchase Details
Closed on
Jan 23, 2013
Sold by
Horton Fred C and Horton Theresa Emmily
Bought by
Ridout Joseph B and Ridout Amy
Home Financials for this Owner
Home Financials are based on the most recent Mortgage that was taken out on this home.
Original Mortgage
$535,200
Interest Rate
3.29%
Mortgage Type
New Conventional
Create a Home Valuation Report for This Property
The Home Valuation Report is an in-depth analysis detailing your home's value as well as a comparison with similar homes in the area
Home Values in the Area
Average Home Value in this Area
Purchase History
| Date | Buyer | Sale Price | Title Company |
|---|---|---|---|
| Ridout Joe | -- | First American Title | |
| Ridout Joe | -- | None Available | |
| Ridout Joseph B | $669,000 | Entitle Insurance Company |
Source: Public Records
Mortgage History
| Date | Status | Borrower | Loan Amount |
|---|---|---|---|
| Previous Owner | Ridout Joe | $373,995 | |
| Previous Owner | Ridout Joseph B | $535,200 |
Source: Public Records
Tax History Compared to Growth
Tax History
| Year | Tax Paid | Tax Assessment Tax Assessment Total Assessment is a certain percentage of the fair market value that is determined by local assessors to be the total taxable value of land and additions on the property. | Land | Improvement |
|---|---|---|---|---|
| 2025 | $11,751 | $823,793 | $492,552 | $331,241 |
| 2024 | $11,751 | $807,643 | $482,896 | $324,747 |
| 2023 | $11,531 | $791,808 | $473,428 | $318,380 |
| 2022 | $10,914 | $776,287 | $464,148 | $312,139 |
| 2021 | $10,739 | $761,067 | $455,048 | $306,019 |
| 2020 | $10,622 | $753,267 | $450,384 | $302,883 |
| 2019 | $10,228 | $738,502 | $441,556 | $296,946 |
| 2018 | $10,124 | $724,025 | $432,900 | $291,125 |
| 2017 | $9,744 | $709,829 | $424,412 | $285,417 |
| 2016 | $9,415 | $695,913 | $416,092 | $279,821 |
| 2015 | $9,076 | $685,464 | $409,844 | $275,620 |
| 2014 | $8,700 | $672,037 | $401,816 | $270,221 |
Source: Public Records
Map
Nearby Homes