Estimated Value: $466,000 - $904,000
3
Beds
4
Baths
1,423
Sq Ft
$474/Sq Ft
Est. Value
About This Home
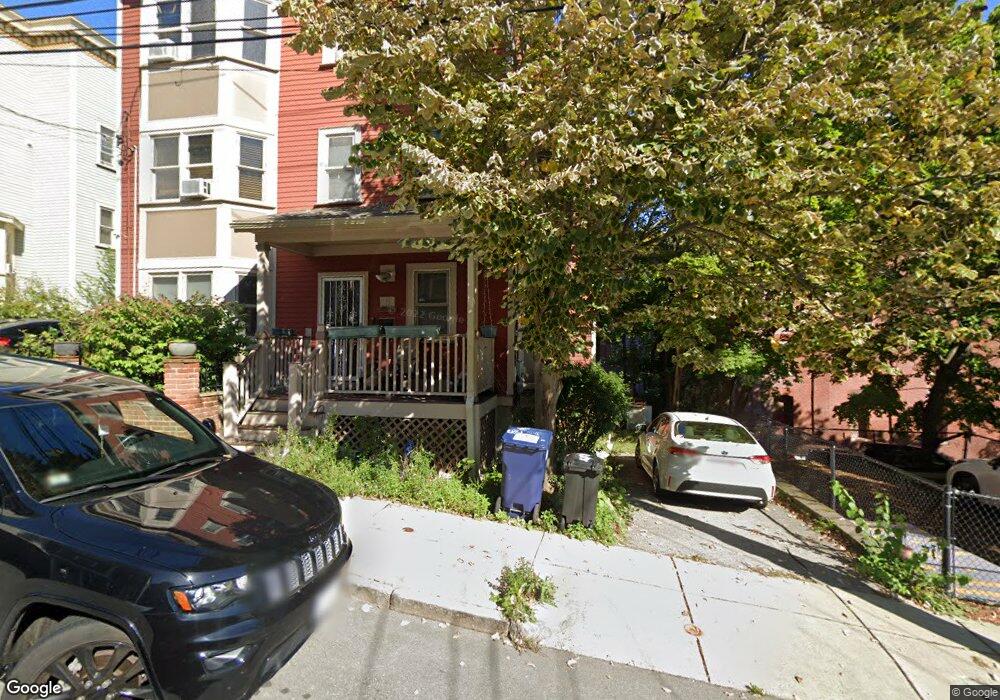
This home is located at 5 Lawn St, Roxbury Crossing, MA 02120 and is currently estimated at $674,898, approximately $474 per square foot. 5 Lawn St is a home located in Suffolk County with nearby schools including Roxbury Preparatory Charter School, Malik Academy, and Manville School.
Ownership History
Date
Name
Owned For
Owner Type
Purchase Details
Closed on
Mar 19, 2004
Sold by
Both Ndc Phase 3 Inc
Bought by
Telore Ramesh Y and Telore Sheba R
Current Estimated Value
Home Financials for this Owner
Home Financials are based on the most recent Mortgage that was taken out on this home.
Original Mortgage
$119,350
Outstanding Balance
$55,935
Interest Rate
5.71%
Mortgage Type
Purchase Money Mortgage
Estimated Equity
$618,963
Create a Home Valuation Report for This Property
The Home Valuation Report is an in-depth analysis detailing your home's value as well as a comparison with similar homes in the area
Home Values in the Area
Average Home Value in this Area
Purchase History
| Date | Buyer | Sale Price | Title Company |
|---|---|---|---|
| Telore Ramesh Y | $155,000 | -- |
Source: Public Records
Mortgage History
| Date | Status | Borrower | Loan Amount |
|---|---|---|---|
| Open | Telore Ramesh Y | $119,350 | |
| Closed | Telore Ramesh Y | $31,000 | |
| Closed | Telore Ramesh Y | $7,937 | |
| Closed | Telore Ramesh Y | $2,825 |
Source: Public Records
Tax History Compared to Growth
Tax History
| Year | Tax Paid | Tax Assessment Tax Assessment Total Assessment is a certain percentage of the fair market value that is determined by local assessors to be the total taxable value of land and additions on the property. | Land | Improvement |
|---|---|---|---|---|
| 2025 | $4,532 | $391,400 | $129,162 | $262,238 |
| 2024 | $4,064 | $372,800 | $100,656 | $272,144 |
| 2023 | $3,813 | $355,000 | $95,850 | $259,150 |
| 2022 | $3,679 | $338,100 | $91,287 | $246,813 |
| 2021 | $3,436 | $322,000 | $0 | $322,000 |
| 2020 | $3,239 | $306,700 | $0 | $306,700 |
| 2019 | $3,079 | $292,100 | $160,800 | $131,300 |
| 2018 | $2,916 | $278,200 | $160,800 | $117,400 |
| 2017 | $2,806 | $265,000 | $160,800 | $104,200 |
| 2016 | $2,776 | $252,400 | $160,800 | $91,600 |
| 2015 | $2,911 | $240,400 | $150,300 | $90,100 |
| 2014 | $2,881 | $229,000 | $150,300 | $78,700 |
Source: Public Records
Map
Nearby Homes
- 10 Bucknam St Unit 2
- 92 Lawn St Unit 7-160
- 22 Fisher Ave
- 6 Fisher Ave
- 70 Day St Unit 2
- 70 Day St
- 70 Day St Unit 1
- 251 Heath St Unit 501
- 3 Kenney St Unit 2
- 36-38 Priesing St
- 10 Bynner St
- 33 Evergreen St Unit 1
- 24 Evergreen St Unit 2
- 24 Sachem St
- 31 Evergreen St Unit 1
- 7 Oswald St
- 55 Mozart St Unit 3
- 66 Mozart St
- 155-157 Hillside St
- 71 Mozart St Unit 3