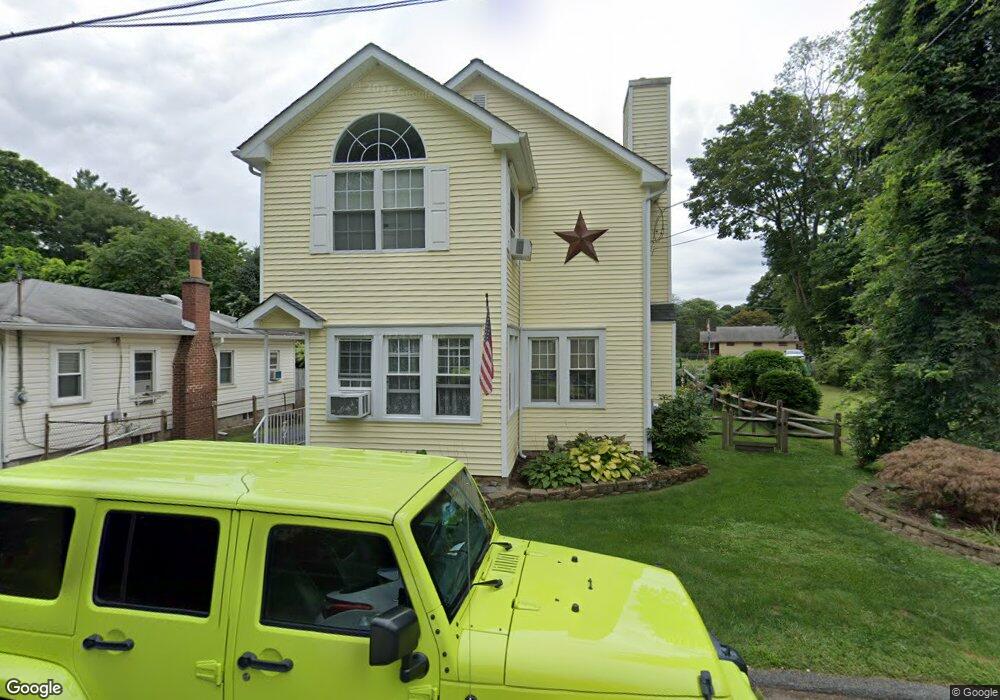
5 Lehigh St Budd Lake, NJ 07828
Estimated Value: $357,573 - $452,000
Studio
--
Bath
1,536
Sq Ft
$271/Sq Ft
Est. Value
About This Home
This home is located at 5 Lehigh St, Budd Lake, NJ 07828 and is currently estimated at $415,643, approximately $270 per square foot. 5 Lehigh St is a home located in Morris County with nearby schools including Mt Olive Middle School and Mount Olive High School.
Ownership History
Date
Name
Owned For
Owner Type
Purchase Details
Closed on
Mar 9, 2001
Sold by
Decker Mark R and Decker Lynne
Bought by
Manning John T and Manning Karen A
Current Estimated Value
Home Financials for this Owner
Home Financials are based on the most recent Mortgage that was taken out on this home.
Original Mortgage
$113,781
Interest Rate
6.9%
Mortgage Type
FHA
Create a Home Valuation Report for This Property
The Home Valuation Report is an in-depth analysis detailing your home's value as well as a comparison with similar homes in the area
Home Values in the Area
Average Home Value in this Area
Purchase History
| Date | Buyer | Sale Price | Title Company |
|---|---|---|---|
| Manning John T | $118,000 | New Jersey Title Insurance C |
Source: Public Records
Mortgage History
| Date | Status | Borrower | Loan Amount |
|---|---|---|---|
| Previous Owner | Manning John T | $113,781 |
Source: Public Records
Tax History
| Year | Tax Paid | Tax Assessment Tax Assessment Total Assessment is a certain percentage of the fair market value that is determined by local assessors to be the total taxable value of land and additions on the property. | Land | Improvement |
|---|---|---|---|---|
| 2025 | $6,963 | $199,800 | $111,100 | $88,700 |
| 2024 | $6,567 | $199,800 | $111,100 | $88,700 |
Source: Public Records
Map
Nearby Homes
Your Personal Tour Guide
Ask me questions while you tour the home.