
Seller's Agent in 2025
Robert Dekanski
RE/MAX
(800) 691-0485
3 in this area
2,617 Total Sales
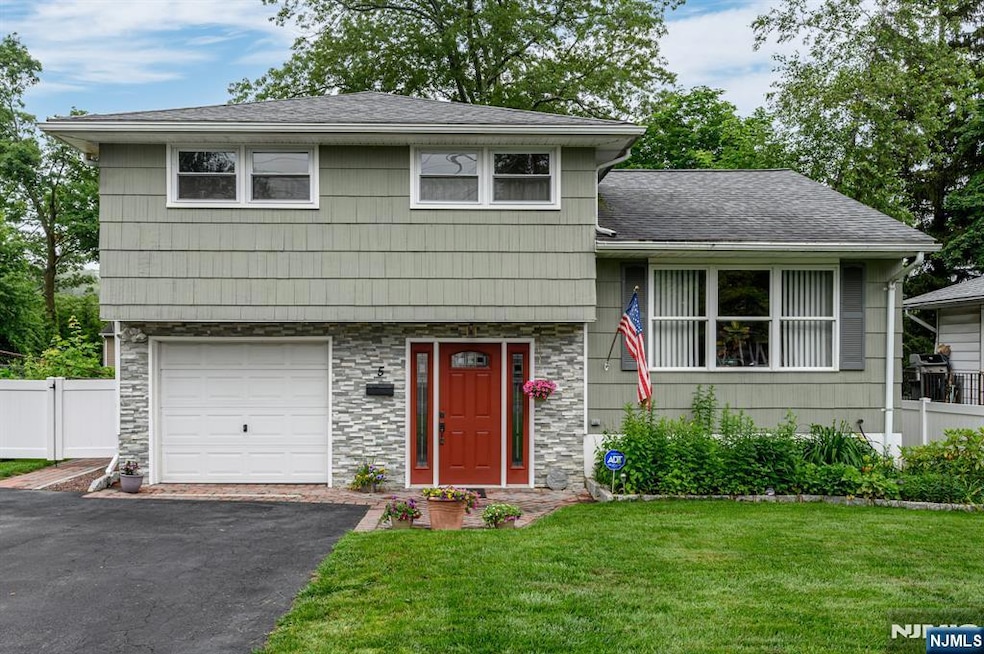
Look no further! Beautiful 3 Bed 1 Bath Split with 1 Car Garage in the desirable Wiltop neighborhood of Netcong could be your Home Sweet Home! Well maintained inside and out with curb appeal in a prime commuter location, with easy access to Netcong Train Station, Main Street amenities, major roads and more. Lovely foyer entry welcomes you up to the light and bright main level to find a spacious living room with large picture window, recessed lighting, and hardwood floors that shine. Elegant formal dining room also features hardwood flooring and chair rail molding, and makes dinner parties a breeze. Eat-in-Kitchen offers ample cabinet storage and dinette space. Upstairs, find the main full bath along with 3 generous bedrooms with carpeting. Peaceful, plush backyard holds a patio and storage shed, and is partially fenced-in for your comfort. 1 car garage with double wide drive offers plenty of extra parking. All of this and so much more! Don't miss out. Come & see TODAY!!
| Date | Type | Sale Price | Title Company |
|---|---|---|---|
| Deed | $450,000 | Passaic Valley Title Service | |
| Deed | $450,000 | Passaic Valley Title Service | |
| Deed | $184,000 | -- | |
| Deed | $121,500 | First American Title Ins Co |
| Date | Status | Loan Amount | Loan Type |
|---|---|---|---|
| Open | $427,500 | New Conventional | |
| Closed | $427,500 | New Conventional | |
| Previous Owner | $147,200 | No Value Available | |
| Previous Owner | $103,250 | No Value Available |
| Date | Event | Price | List to Sale | Price per Sq Ft |
|---|---|---|---|---|
| 08/22/2025 08/22/25 | Sold | $450,000 | +12.5% | $329 / Sq Ft |
| 07/01/2025 07/01/25 | Pending | -- | -- | -- |
| 06/18/2025 06/18/25 | For Sale | $399,999 | -- | $292 / Sq Ft |
| Year | Tax Paid | Tax Assessment Tax Assessment Total Assessment is a certain percentage of the fair market value that is determined by local assessors to be the total taxable value of land and additions on the property. | Land | Improvement |
|---|---|---|---|---|
| 2025 | $8,502 | $248,800 | $125,000 | $123,800 |
| 2024 | $8,576 | $248,800 | $125,000 | $123,800 |
| 2023 | $8,576 | $248,800 | $125,000 | $123,800 |
| 2022 | $7,770 | $248,800 | $125,000 | $123,800 |
| 2021 | $7,770 | $248,800 | $125,000 | $123,800 |
| 2020 | $7,884 | $256,300 | $155,000 | $101,300 |
| 2019 | $7,504 | $256,300 | $155,000 | $101,300 |
| 2018 | $7,056 | $256,300 | $155,000 | $101,300 |
| 2017 | $6,779 | $256,300 | $155,000 | $101,300 |
| 2016 | $6,595 | $256,300 | $155,000 | $101,300 |
| 2015 | $6,354 | $256,300 | $155,000 | $101,300 |
| 2014 | $6,077 | $256,300 | $155,000 | $101,300 |
Seller's Agent in 2025
Robert Dekanski
RE/MAX
(800) 691-0485
3 in this area
2,617 Total Sales
Buyer's Agent in 2025
Diane LoDrago
Weichert Corporate
(973) 405-0539
1 in this area
10 Total Sales
Source: New Jersey MLS
MLS Number: 25021260
APN: 28-00031-0000-00004
Disclaimer: Certain information contained herein is derived from information provided by parties other than Homes.com. All information provided is deemed reliable, but is not guaranteed to be accurate and should be independently verified.
![]() The data relating to the real estate for sale on this web site comes in part from the Internet Data Exchange Program of the NJMLS. Real estate listings held by brokerage firms other than Ten-X are marked with the Internet Data Exchange logo and information about them includes the name of the listing brokers. Some properties listed with the participating brokers do not appear on this website at the request of the seller. Listings of brokers that do not participate in Internet Data Exchange do not appear on this website.
The data relating to the real estate for sale on this web site comes in part from the Internet Data Exchange Program of the NJMLS. Real estate listings held by brokerage firms other than Ten-X are marked with the Internet Data Exchange logo and information about them includes the name of the listing brokers. Some properties listed with the participating brokers do not appear on this website at the request of the seller. Listings of brokers that do not participate in Internet Data Exchange do not appear on this website.
All information deemed reliable but not guaranteed. Source: New Jersey Multiple Listing, Inc.
© 2025 New Jersey Multiple Listing Service Inc. All rights reserved.