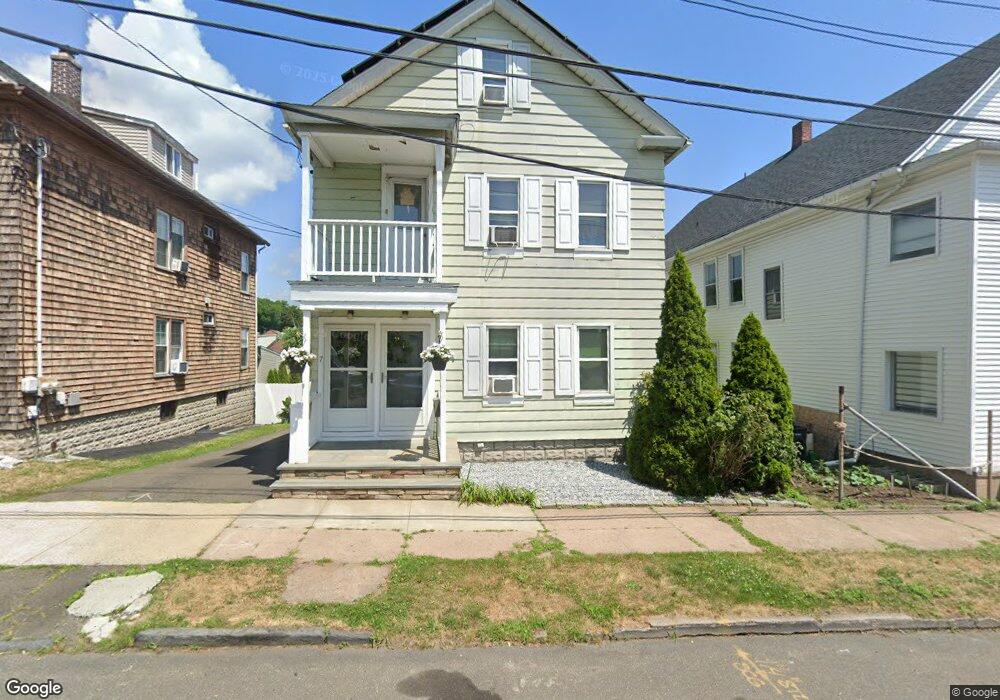
5 Lyman St New Haven, CT 06511
East Rock NeighborhoodEstimated Value: $361,000 - $420,350
4
Beds
2
Baths
2,153
Sq Ft
$184/Sq Ft
Est. Value
About This Home
This home is located at 5 Lyman St, New Haven, CT 06511 and is currently estimated at $396,338, approximately $184 per square foot. 5 Lyman St is a home located in New Haven County with nearby schools including East Rock Community Magnet School, Elm City College Preparatory School, and St Francis & St Rose Of Lima School.
Ownership History
Date
Name
Owned For
Owner Type
Purchase Details
Closed on
Dec 1, 2006
Sold by
Zayas Victor and Valentin Audrey
Bought by
Gutierrez Leonardo
Current Estimated Value
Home Financials for this Owner
Home Financials are based on the most recent Mortgage that was taken out on this home.
Original Mortgage
$216,000
Interest Rate
6.36%
Purchase Details
Closed on
Jul 3, 2006
Sold by
Rivera Maria
Bought by
Zayas Victor and Valentin Audrey
Purchase Details
Closed on
Oct 24, 2003
Sold by
Zayas Marian
Bought by
Rivera Maria L
Purchase Details
Closed on
Jan 27, 2000
Sold by
Natl Assoc Prop
Bought by
Zayas Marian
Create a Home Valuation Report for This Property
The Home Valuation Report is an in-depth analysis detailing your home's value as well as a comparison with similar homes in the area
Home Values in the Area
Average Home Value in this Area
Purchase History
| Date | Buyer | Sale Price | Title Company |
|---|---|---|---|
| Gutierrez Leonardo | $270,000 | -- | |
| Zayas Victor | $200,000 | -- | |
| Rivera Maria L | $125,000 | -- | |
| Zayas Marian | $67,000 | -- |
Source: Public Records
Mortgage History
| Date | Status | Borrower | Loan Amount |
|---|---|---|---|
| Open | Zayas Marian | $207,075 | |
| Closed | Zayas Marian | $207,675 | |
| Closed | Zayas Marian | $216,000 |
Source: Public Records
Tax History Compared to Growth
Tax History
| Year | Tax Paid | Tax Assessment Tax Assessment Total Assessment is a certain percentage of the fair market value that is determined by local assessors to be the total taxable value of land and additions on the property. | Land | Improvement |
|---|---|---|---|---|
| 2025 | $5,486 | $139,230 | $27,440 | $111,790 |
| 2024 | $5,360 | $139,230 | $27,440 | $111,790 |
| 2023 | $5,179 | $139,230 | $27,440 | $111,790 |
| 2022 | $5,534 | $139,230 | $27,440 | $111,790 |
| 2021 | $3,585 | $81,690 | $21,980 | $59,710 |
| 2020 | $3,585 | $81,690 | $21,980 | $59,710 |
| 2019 | $3,511 | $81,690 | $21,980 | $59,710 |
| 2018 | $3,364 | $78,260 | $21,980 | $56,280 |
| 2017 | $3,027 | $78,260 | $21,980 | $56,280 |
| 2016 | $2,545 | $61,250 | $14,630 | $46,620 |
| 2015 | $2,545 | $61,250 | $14,630 | $46,620 |
| 2014 | $2,545 | $61,250 | $14,630 | $46,620 |
Source: Public Records
Map
Nearby Homes