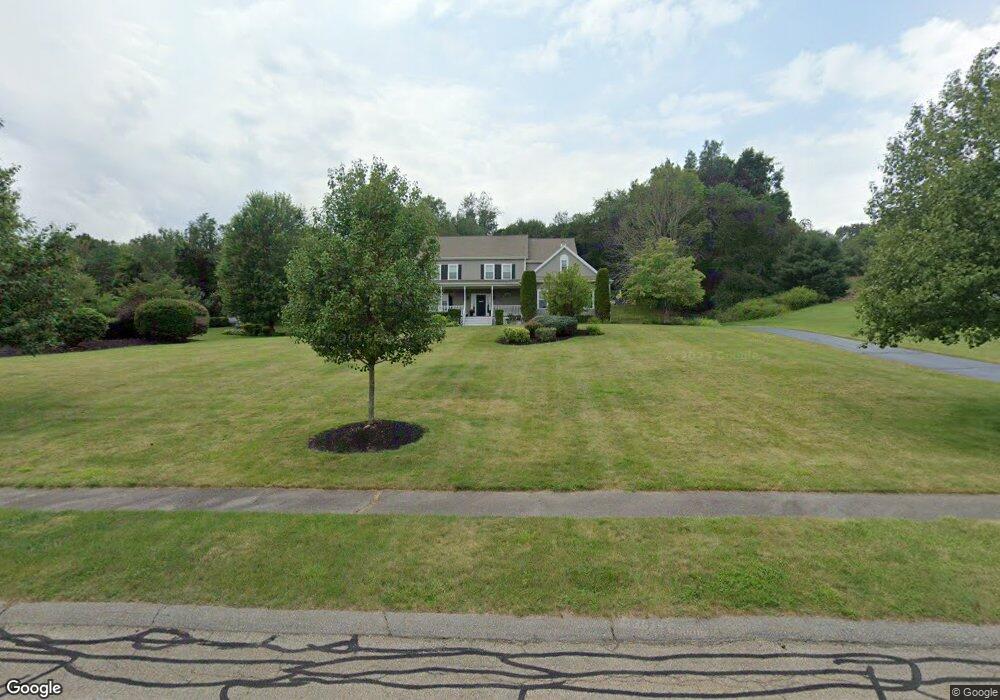
5 Macdougald Dr Wrentham, MA 02093
West Wrentham NeighborhoodEstimated Value: $1,026,969 - $1,280,000
4
Beds
4
Baths
2,860
Sq Ft
$395/Sq Ft
Est. Value
About This Home
This home is located at 5 Macdougald Dr, Wrentham, MA 02093 and is currently estimated at $1,128,992, approximately $394 per square foot. 5 Macdougald Dr is a home located in Norfolk County with nearby schools including Delaney Elementary School, Charles E Roderick, and Benjamin Franklin Classical Charter Public School.
Ownership History
Date
Name
Owned For
Owner Type
Purchase Details
Closed on
Jul 21, 2021
Sold by
Poirier Ralph P and Poirier Debra L
Bought by
Rowell Kenneth and Rowell Anne F
Current Estimated Value
Home Financials for this Owner
Home Financials are based on the most recent Mortgage that was taken out on this home.
Original Mortgage
$450,000
Outstanding Balance
$408,679
Interest Rate
2.96%
Mortgage Type
Purchase Money Mortgage
Estimated Equity
$720,313
Purchase Details
Closed on
Jul 7, 1998
Sold by
Pare Leo A
Bought by
Poirier Ralph P and Poirier Debra L
Create a Home Valuation Report for This Property
The Home Valuation Report is an in-depth analysis detailing your home's value as well as a comparison with similar homes in the area
Home Values in the Area
Average Home Value in this Area
Purchase History
| Date | Buyer | Sale Price | Title Company |
|---|---|---|---|
| Rowell Kenneth | $850,000 | None Available | |
| Poirier Ralph P | $386,250 | -- |
Source: Public Records
Mortgage History
| Date | Status | Borrower | Loan Amount |
|---|---|---|---|
| Open | Rowell Kenneth | $450,000 | |
| Previous Owner | Poirier Ralph P | $82,500 | |
| Previous Owner | Poirier Ralph P | $417,000 | |
| Previous Owner | Poirier Ralph P | $25,000 |
Source: Public Records
Tax History Compared to Growth
Tax History
| Year | Tax Paid | Tax Assessment Tax Assessment Total Assessment is a certain percentage of the fair market value that is determined by local assessors to be the total taxable value of land and additions on the property. | Land | Improvement |
|---|---|---|---|---|
| 2025 | $10,928 | $942,900 | $331,300 | $611,600 |
| 2024 | $10,524 | $877,000 | $331,300 | $545,700 |
| 2023 | $10,606 | $840,400 | $301,300 | $539,100 |
| 2022 | $10,076 | $737,100 | $281,400 | $455,700 |
| 2021 | $9,365 | $665,600 | $245,600 | $420,000 |
| 2020 | $9,592 | $673,100 | $218,600 | $454,500 |
| 2019 | $9,218 | $652,800 | $218,600 | $434,200 |
| 2018 | $8,622 | $605,500 | $218,200 | $387,300 |
| 2017 | $8,390 | $588,800 | $214,000 | $374,800 |
| 2016 | $8,275 | $579,500 | $207,800 | $371,700 |
| 2015 | $8,242 | $550,200 | $199,800 | $350,400 |
| 2014 | $8,350 | $545,400 | $192,200 | $353,200 |
Source: Public Records
Map
Nearby Homes
- 60 Grant Ave
- 2095 West St
- 50 Heather Ln
- 180 Pine Swamp Rd
- 56 Pine Swamp Rd
- 25 Nature View Dr
- 236 Williams St
- 20 Nature View Dr
- 39 Sumner Brown Rd
- 9 Pebble Cir Unit 9
- 219 Dawn Blvd
- 300 Tower Hill Rd
- 245 W Wrentham Rd
- 4022 Diamond Hill Rd
- 65 Palmetto Dr Unit 65
- 21 Palmetto Dr Unit 21
- 24 Palmetto Dr Unit 24
- 10 Stoneham Dr
- 4 Carnation St
- 29 Squire Ln