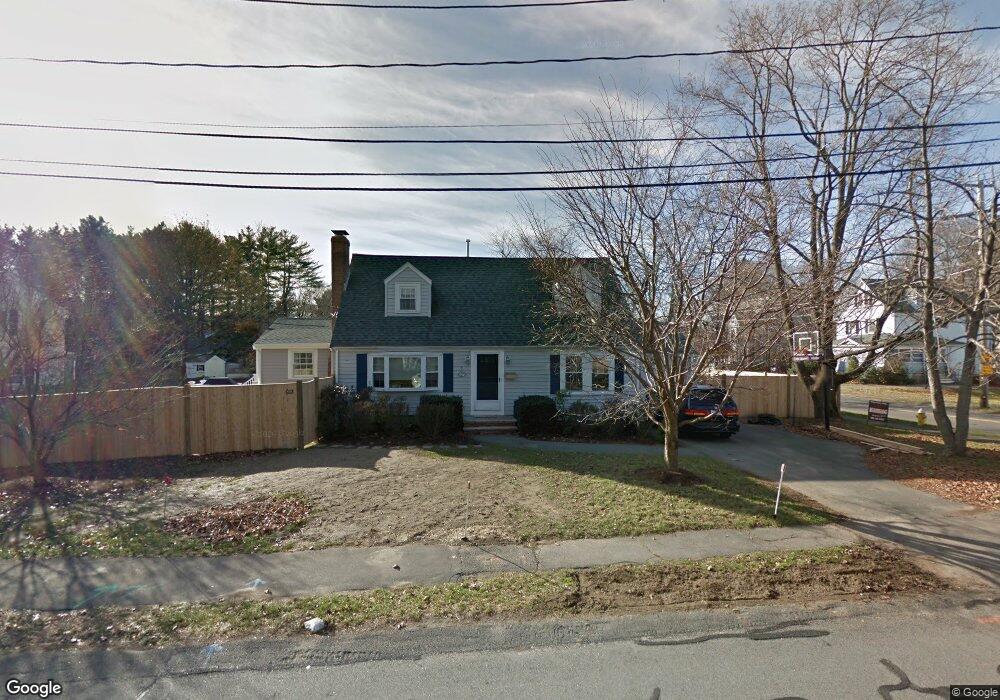
5 Manning St Needham Heights, MA 02494
Estimated Value: $1,454,000 - $1,651,000
4
Beds
3
Baths
1,447
Sq Ft
$1,055/Sq Ft
Est. Value
About This Home
This home is located at 5 Manning St, Needham Heights, MA 02494 and is currently estimated at $1,526,183, approximately $1,054 per square foot. 5 Manning St is a home located in Norfolk County with nearby schools including Mitchell Elementary School, High Rock Middle School, and Pollard Middle School.
Ownership History
Date
Name
Owned For
Owner Type
Purchase Details
Closed on
Oct 10, 2019
Sold by
Hynes William M and Hynes Laura M
Bought by
5 Manning Street Rt
Current Estimated Value
Purchase Details
Closed on
Oct 21, 1999
Sold by
Kaufman Jeffrey A and Kaufman Marnie A
Bought by
Hynes William M and Hynes Laura M
Home Financials for this Owner
Home Financials are based on the most recent Mortgage that was taken out on this home.
Original Mortgage
$342,800
Interest Rate
7.83%
Mortgage Type
Purchase Money Mortgage
Purchase Details
Closed on
Jun 30, 1994
Sold by
Dahan Uri M and Dahan Irit
Bought by
Kaufman Jeffrey A and Kaufman Marnie A
Home Financials for this Owner
Home Financials are based on the most recent Mortgage that was taken out on this home.
Original Mortgage
$236,800
Interest Rate
8.55%
Mortgage Type
Purchase Money Mortgage
Create a Home Valuation Report for This Property
The Home Valuation Report is an in-depth analysis detailing your home's value as well as a comparison with similar homes in the area
Home Values in the Area
Average Home Value in this Area
Purchase History
| Date | Buyer | Sale Price | Title Company |
|---|---|---|---|
| 5 Manning Street Rt | -- | -- | |
| Hynes William M | $428,500 | -- | |
| Kaufman Jeffrey A | $296,000 | -- |
Source: Public Records
Mortgage History
| Date | Status | Borrower | Loan Amount |
|---|---|---|---|
| Previous Owner | Kaufman Jeffrey A | $417,000 | |
| Previous Owner | Kaufman Jeffrey A | $342,800 | |
| Previous Owner | Kaufman Jeffrey A | $236,800 |
Source: Public Records
Tax History Compared to Growth
Tax History
| Year | Tax Paid | Tax Assessment Tax Assessment Total Assessment is a certain percentage of the fair market value that is determined by local assessors to be the total taxable value of land and additions on the property. | Land | Improvement |
|---|---|---|---|---|
| 2025 | $12,745 | $1,202,400 | $774,700 | $427,700 |
| 2024 | $13,214 | $1,055,400 | $553,300 | $502,100 |
| 2023 | $13,301 | $1,020,000 | $553,300 | $466,700 |
| 2022 | $12,509 | $935,600 | $485,500 | $450,100 |
| 2021 | $12,191 | $935,600 | $485,500 | $450,100 |
| 2020 | $11,910 | $953,600 | $485,500 | $468,100 |
| 2019 | $11,142 | $899,300 | $441,500 | $457,800 |
| 2018 | $10,684 | $899,300 | $441,500 | $457,800 |
| 2017 | $10,067 | $846,700 | $441,500 | $405,200 |
| 2016 | $9,771 | $846,700 | $441,500 | $405,200 |
| 2015 | $9,559 | $846,700 | $441,500 | $405,200 |
| 2014 | $9,309 | $799,700 | $401,500 | $398,200 |
Source: Public Records
Map
Nearby Homes
- 77 High St
- 36 Davenport Rd
- 556 Webster St
- 400 Hunnewell St Unit 103
- 403 Hunnewell St Unit 403
- 3 Crescent Rd
- 379 Hunnewell St Unit 379
- 9 Jayne Rd
- 143 Hunting Rd
- 445 Hillside Ave
- 7 Avery St
- 190 Brookline St
- 23 Cheney St
- 62 Evelyn Rd
- 35 Andrea Cir
- 34 Pershing Rd
- 332 Hillcrest Rd
- 41 Lee Rd
- 12 Hill St
- 40 Otis St Unit L