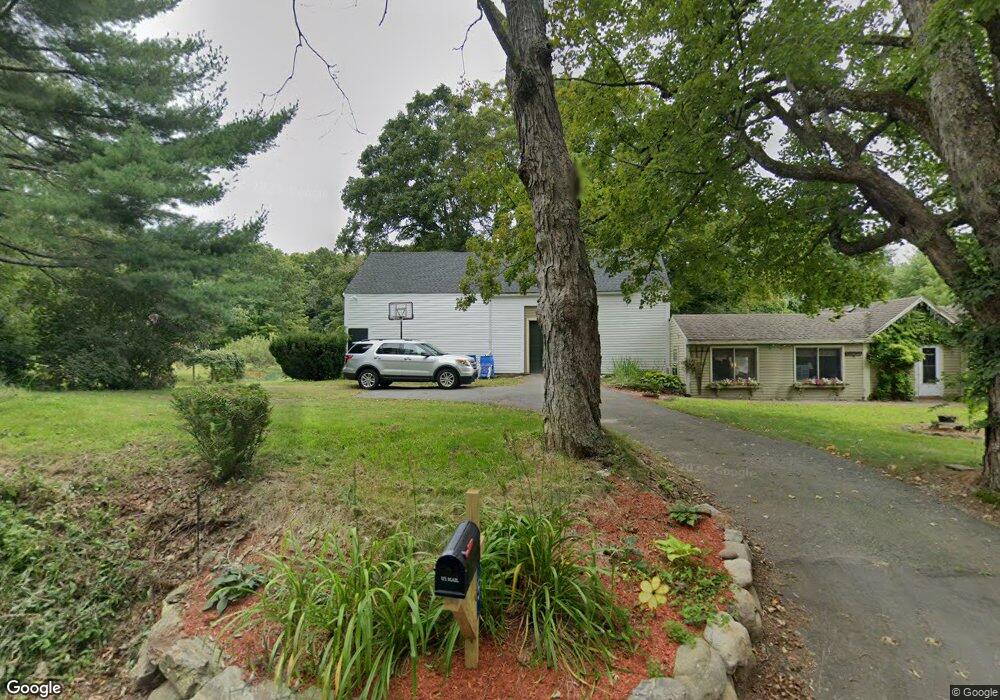
5 Maple Ave Newton, NH 03858
Estimated Value: $513,000 - $523,000
3
Beds
2
Baths
1,602
Sq Ft
$324/Sq Ft
Est. Value
About This Home
This home is located at 5 Maple Ave, Newton, NH 03858 and is currently estimated at $519,021, approximately $323 per square foot. 5 Maple Ave is a home located in Rockingham County with nearby schools including Memorial School, Sanborn Regional Middle School, and Sanborn Regional High School.
Ownership History
Date
Name
Owned For
Owner Type
Purchase Details
Closed on
Nov 17, 2003
Sold by
Parsons John A and Parsons Robin L
Bought by
Blomberg Timothy and Blomberg Julie
Current Estimated Value
Home Financials for this Owner
Home Financials are based on the most recent Mortgage that was taken out on this home.
Original Mortgage
$234,400
Interest Rate
5.81%
Purchase Details
Closed on
Mar 31, 1997
Sold by
Shea Robert H and Shea Lynanne E
Bought by
Parsons John and Parsons Robin L
Home Financials for this Owner
Home Financials are based on the most recent Mortgage that was taken out on this home.
Original Mortgage
$70,000
Interest Rate
7.59%
Create a Home Valuation Report for This Property
The Home Valuation Report is an in-depth analysis detailing your home's value as well as a comparison with similar homes in the area
Home Values in the Area
Average Home Value in this Area
Purchase History
| Date | Buyer | Sale Price | Title Company |
|---|---|---|---|
| Blomberg Timothy | $293,000 | -- | |
| Parsons John | $102,500 | -- |
Source: Public Records
Mortgage History
| Date | Status | Borrower | Loan Amount |
|---|---|---|---|
| Open | Parsons John | $221,000 | |
| Closed | Parsons John | $234,400 | |
| Previous Owner | Parsons John | $70,000 |
Source: Public Records
Tax History Compared to Growth
Tax History
| Year | Tax Paid | Tax Assessment Tax Assessment Total Assessment is a certain percentage of the fair market value that is determined by local assessors to be the total taxable value of land and additions on the property. | Land | Improvement |
|---|---|---|---|---|
| 2024 | $7,697 | $303,400 | $120,700 | $182,700 |
| 2023 | $7,467 | $303,400 | $120,700 | $182,700 |
| 2022 | $6,823 | $303,400 | $120,700 | $182,700 |
| 2021 | $6,341 | $303,400 | $120,700 | $182,700 |
| 2020 | $6,341 | $303,400 | $120,700 | $182,700 |
| 2019 | $6,500 | $246,400 | $85,800 | $160,600 |
| 2018 | $6,303 | $246,400 | $85,800 | $160,600 |
| 2017 | $6,549 | $246,400 | $85,800 | $160,600 |
| 2016 | $6,446 | $246,400 | $85,800 | $160,600 |
| 2015 | $6,448 | $246,400 | $85,800 | $160,600 |
| 2014 | $6,633 | $255,700 | $94,300 | $161,400 |
| 2013 | $6,469 | $255,700 | $94,300 | $161,400 |
Source: Public Records
Map
Nearby Homes