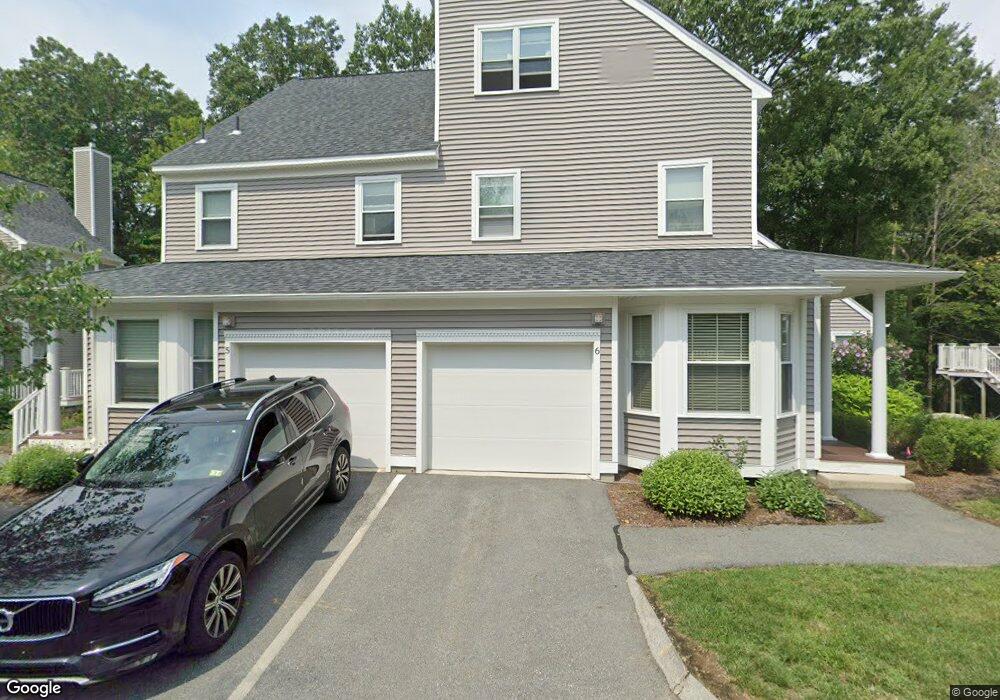
5 Maple Ridge Dr Burlington, MA 01803
Burlington Town Center NeighborhoodEstimated Value: $833,000 - $895,000
2
Beds
3
Baths
2,310
Sq Ft
$379/Sq Ft
Est. Value
About This Home
This home is located at 5 Maple Ridge Dr, Burlington, MA 01803 and is currently estimated at $874,523, approximately $378 per square foot. 5 Maple Ridge Dr is a home located in Middlesex County with nearby schools including Burlington High School, Marshall Simonds Middle School, and Mount Hope Christian School.
Ownership History
Date
Name
Owned For
Owner Type
Purchase Details
Closed on
Jul 11, 2017
Sold by
Miller Ann T Est
Bought by
Zhang Binbin and Zhang Anren
Current Estimated Value
Home Financials for this Owner
Home Financials are based on the most recent Mortgage that was taken out on this home.
Original Mortgage
$303,000
Outstanding Balance
$254,194
Interest Rate
4.25%
Mortgage Type
Adjustable Rate Mortgage/ARM
Estimated Equity
$620,329
Purchase Details
Closed on
Aug 16, 1999
Sold by
Soueidan Bassem and Soueidan Zeina
Bought by
Miller Ann T
Home Financials for this Owner
Home Financials are based on the most recent Mortgage that was taken out on this home.
Original Mortgage
$53,250
Interest Rate
7.49%
Purchase Details
Closed on
Jun 24, 1997
Sold by
Burlington Ponds Lp and Maynard
Bought by
Soueidan Bassem and Soueidan Zeima
Home Financials for this Owner
Home Financials are based on the most recent Mortgage that was taken out on this home.
Original Mortgage
$246,000
Interest Rate
7.87%
Mortgage Type
Purchase Money Mortgage
Create a Home Valuation Report for This Property
The Home Valuation Report is an in-depth analysis detailing your home's value as well as a comparison with similar homes in the area
Home Values in the Area
Average Home Value in this Area
Purchase History
| Date | Buyer | Sale Price | Title Company |
|---|---|---|---|
| Zhang Binbin | $533,000 | -- | |
| Miller Ann T | $339,000 | -- | |
| Soueidan Bassem | $307,500 | -- |
Source: Public Records
Mortgage History
| Date | Status | Borrower | Loan Amount |
|---|---|---|---|
| Open | Zhang Binbin | $303,000 | |
| Closed | Soueidan Bassem | $303,000 | |
| Previous Owner | Soueidan Bassem | $53,250 | |
| Previous Owner | Soueidan Bassem | $246,000 |
Source: Public Records
Tax History Compared to Growth
Tax History
| Year | Tax Paid | Tax Assessment Tax Assessment Total Assessment is a certain percentage of the fair market value that is determined by local assessors to be the total taxable value of land and additions on the property. | Land | Improvement |
|---|---|---|---|---|
| 2025 | $6,875 | $793,900 | $0 | $793,900 |
| 2024 | $6,339 | $709,100 | $0 | $709,100 |
| 2023 | $6,190 | $658,500 | $0 | $658,500 |
| 2022 | $5,799 | $582,800 | $0 | $582,800 |
| 2021 | $13,110 | $534,200 | $0 | $534,200 |
| 2020 | $5,618 | $582,800 | $0 | $582,800 |
| 2019 | $5,802 | $553,600 | $0 | $553,600 |
| 2018 | $5,502 | $518,100 | $0 | $518,100 |
| 2017 | $10,868 | $518,100 | $0 | $518,100 |
| 2016 | $5,076 | $442,900 | $0 | $442,900 |
| 2015 | $4,915 | $433,000 | $0 | $433,000 |
| 2014 | $4,831 | $402,600 | $0 | $402,600 |
Source: Public Records
Map
Nearby Homes
- 50 Hill Cir
- 29 Grove Ln Unit 29
- 129 Cambridge St Unit 1
- 5 Shady Lane Dr
- 29 Overlook Ave
- 210 Winn St
- 4 Ardmore Ave
- 18 Winn Valley Dr
- 19 Hammond Place Unit 19
- 68 Hammond Place Unit 68
- 9 Woodside Ln
- 82 Lowell St
- 38 Freeport Dr
- 6 Arthur Woods Ave
- 27 Purity Springs Rd
- 10 Murray Ave Unit 15
- 12 Murray Ave Unit 18
- 36 Cambridge Rd Unit 40
- 19 Carey Ave
- 51 Terrace Hall Ave
- 6 Maple Ridge Dr
- 5 Maple Ridge Dr
- 5 Maple Ridge Dr Unit 5
- 4 Maple Ridge Dr
- 3 Maple Ridge Dr
- 2 Maple Ridge Dr
- 20 Maple Ridge Dr
- 19 Maple Ridge Dr
- 10 Maple Ridge Dr
- 9 Maple Ridge Dr
- 8 Maple Ridge Dr
- 7 Maple Ridge Dr
- 9 Maple Ridge Dr
- 10 Maple Ridge Dr Unit 10
- 9 Maple Ridge Dr Unit 9
- 10 Maple Ridge Dr Unit 10,0
- 7 Maple Ridge Dr Unit 7,3
- 18 Maple Ridge Dr
- 17 Maple Ridge Dr
- 23 Pond Ln