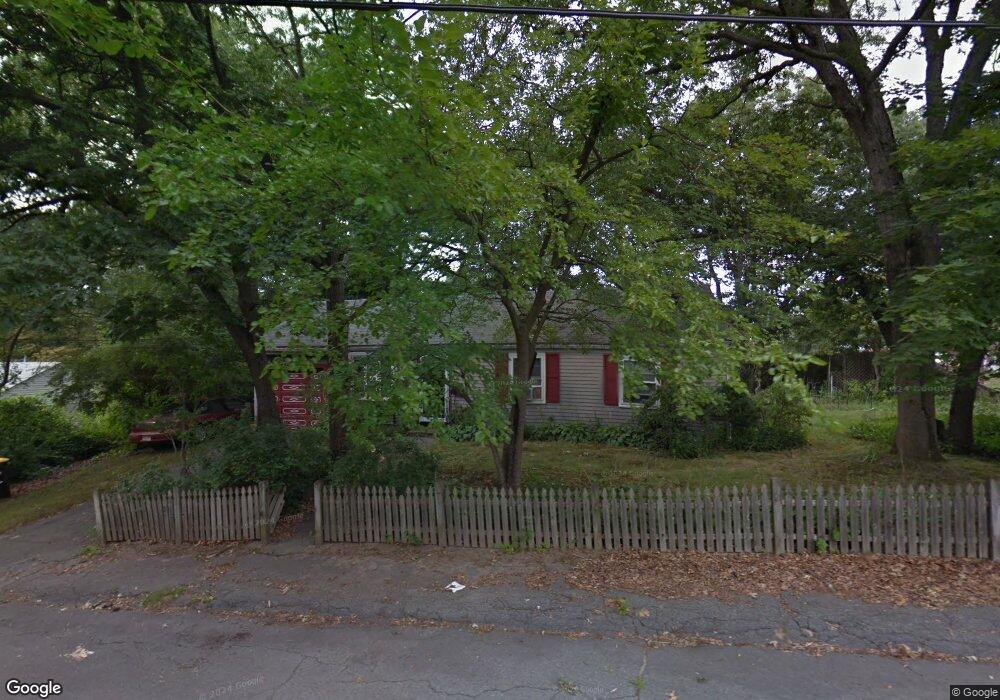
5 Mars St Weymouth, MA 02188
South Weymouth NeighborhoodEstimated Value: $533,834 - $681,000
3
Beds
1
Bath
1,152
Sq Ft
$501/Sq Ft
Est. Value
About This Home
This home is located at 5 Mars St, Weymouth, MA 02188 and is currently estimated at $576,709, approximately $500 per square foot. 5 Mars St is a home located in Norfolk County with nearby schools including Thomas V Nash, Abigail Adams Middle School, and Weymouth Middle School Chapman.
Ownership History
Date
Name
Owned For
Owner Type
Purchase Details
Closed on
Jul 26, 1988
Sold by
Jennings Judith A
Bought by
Nolan Stephen W
Current Estimated Value
Home Financials for this Owner
Home Financials are based on the most recent Mortgage that was taken out on this home.
Original Mortgage
$111,200
Interest Rate
10.49%
Mortgage Type
Purchase Money Mortgage
Create a Home Valuation Report for This Property
The Home Valuation Report is an in-depth analysis detailing your home's value as well as a comparison with similar homes in the area
Home Values in the Area
Average Home Value in this Area
Purchase History
| Date | Buyer | Sale Price | Title Company |
|---|---|---|---|
| Nolan Stephen W | $150,000 | -- |
Source: Public Records
Mortgage History
| Date | Status | Borrower | Loan Amount |
|---|---|---|---|
| Open | Nolan Stephen W | $120,807 | |
| Closed | Nolan Stephen W | $111,200 |
Source: Public Records
Tax History
| Year | Tax Paid | Tax Assessment Tax Assessment Total Assessment is a certain percentage of the fair market value that is determined by local assessors to be the total taxable value of land and additions on the property. | Land | Improvement |
|---|---|---|---|---|
| 2025 | $4,301 | $425,800 | $205,500 | $220,300 |
| 2024 | $4,166 | $405,600 | $195,700 | $209,900 |
| 2023 | $4,003 | $383,100 | $181,200 | $201,900 |
| 2022 | $3,919 | $342,000 | $167,800 | $174,200 |
| 2021 | $3,656 | $311,400 | $167,800 | $143,600 |
| 2020 | $3,526 | $295,800 | $167,800 | $128,000 |
| 2019 | $3,373 | $278,300 | $161,300 | $117,000 |
| 2018 | $3,276 | $262,100 | $153,600 | $108,500 |
| 2017 | $3,165 | $247,100 | $146,400 | $100,700 |
| 2016 | $3,040 | $237,500 | $140,700 | $96,800 |
| 2015 | $2,952 | $228,800 | $140,700 | $88,100 |
| 2014 | $2,701 | $203,100 | $117,900 | $85,200 |
Source: Public Records
Map
Nearby Homes
- 300 West St
- 17 Berean Way
- 73 Ryder Rd
- 501 Commerce Dr Unit 2110
- 501 Commerce Dr Unit 4308
- 2 Mitchell Ln Unit B
- 432 Grove St
- 750 Main St
- 972 Liberty St
- 27 Park Ave
- 365 Tilden Commons Ln Unit 365
- 54 Old Quarry Dr
- 30 Alroy Rd
- 15 Alroy Rd
- 8 Tara Dr Unit 4
- 8 Tara Dr Unit 5
- 169 Tyson Commons Ln
- 55 Bradford Commons Ln Unit 55
- 193 Randolph St
- 139 Randolph St
Your Personal Tour Guide
Ask me questions while you tour the home.