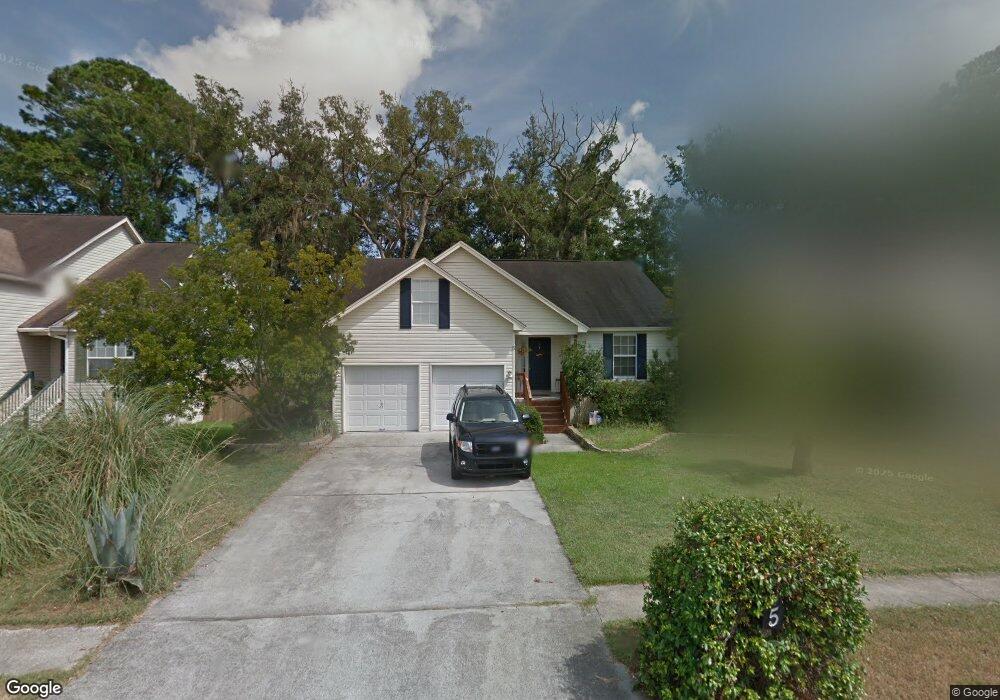
5 Marsh Hen Ct Savannah, GA 31419
Estimated Value: $286,000 - $303,000
4
Beds
2
Baths
1,520
Sq Ft
$192/Sq Ft
Est. Value
About This Home
This home is located at 5 Marsh Hen Ct, Savannah, GA 31419 and is currently estimated at $292,235, approximately $192 per square foot. 5 Marsh Hen Ct is a home located in Chatham County with nearby schools including Southwest Elementary School, Windsor Forest High School, and Southwest Middle School.
Ownership History
Date
Name
Owned For
Owner Type
Purchase Details
Closed on
Sep 7, 2021
Sold by
Sorrelle Erick
Bought by
Trahe Valencia Alexander
Current Estimated Value
Home Financials for this Owner
Home Financials are based on the most recent Mortgage that was taken out on this home.
Original Mortgage
$215,853
Outstanding Balance
$196,410
Interest Rate
2.8%
Mortgage Type
VA
Estimated Equity
$95,825
Purchase Details
Closed on
Feb 9, 2018
Sold by
Kilby Rodney
Bought by
Sorrelle Erick
Home Financials for this Owner
Home Financials are based on the most recent Mortgage that was taken out on this home.
Original Mortgage
$151,210
Interest Rate
3.75%
Mortgage Type
FHA
Purchase Details
Closed on
Mar 23, 2017
Sold by
Kilby Christina
Bought by
Kilby Rodney
Purchase Details
Closed on
Mar 19, 2010
Sold by
Silvoy Ronald J
Bought by
Kilby Rodney and Kilby Christina
Home Financials for this Owner
Home Financials are based on the most recent Mortgage that was taken out on this home.
Original Mortgage
$158,332
Interest Rate
4.91%
Mortgage Type
VA
Purchase Details
Closed on
Dec 7, 2004
Sold by
Emfinger Grady A and Emfinger Patricia
Bought by
Silvoy Ronald J
Create a Home Valuation Report for This Property
The Home Valuation Report is an in-depth analysis detailing your home's value as well as a comparison with similar homes in the area
Home Values in the Area
Average Home Value in this Area
Purchase History
| Date | Buyer | Sale Price | Title Company |
|---|---|---|---|
| Trahe Valencia Alexander | $211,000 | -- | |
| Sorrelle Erick | $154,000 | -- | |
| Kilby Rodney | -- | -- | |
| Kilby Rodney | $155,000 | -- | |
| Silvoy Ronald J | $132,300 | -- |
Source: Public Records
Mortgage History
| Date | Status | Borrower | Loan Amount |
|---|---|---|---|
| Open | Trahe Valencia Alexander | $215,853 | |
| Previous Owner | Sorrelle Erick | $151,210 | |
| Previous Owner | Kilby Rodney | $158,332 |
Source: Public Records
Tax History Compared to Growth
Tax History
| Year | Tax Paid | Tax Assessment Tax Assessment Total Assessment is a certain percentage of the fair market value that is determined by local assessors to be the total taxable value of land and additions on the property. | Land | Improvement |
|---|---|---|---|---|
| 2025 | $5,659 | $124,080 | $22,000 | $102,080 |
| 2024 | $5,659 | $124,800 | $22,000 | $102,800 |
| 2023 | $3,059 | $87,360 | $16,000 | $71,360 |
| 2022 | $1,828 | $80,480 | $16,000 | $64,480 |
| 2021 | $1,928 | $62,000 | $8,800 | $53,200 |
| 2020 | $1,837 | $60,520 | $8,800 | $51,720 |
| 2019 | $1,950 | $58,440 | $8,800 | $49,640 |
| 2018 | $1,862 | $56,600 | $8,800 | $47,800 |
| 2017 | $1,749 | $57,560 | $8,800 | $48,760 |
| 2016 | $1,821 | $52,520 | $8,800 | $43,720 |
| 2015 | $1,844 | $53,120 | $8,800 | $44,320 |
| 2014 | -- | $54,320 | $0 | $0 |
Source: Public Records
Map
Nearby Homes
- 10 Snowy Egret Ct
- 30 Orchid Ln
- 34 Orchid Ln
- 16 Orchid Ln
- 263 Sugar Mill Dr
- 13 Bimini Dr
- 1 Sugar Cane Dr
- 125 Sugar Mill Dr
- 128 Cambridge Dr
- 2 Seagull Ln
- 10 Whittington Ct
- 777 King George Blvd Unit 51
- 317 Lakeshore Dr
- 223 Lakeshore Dr
- 127 Lakeshore Dr
- 210 Pine Grove Dr
- 118 Companion Way
- 5747 Ogeechee Rd
- 102 Pine Grove Dr
- 101 Laurens Ln