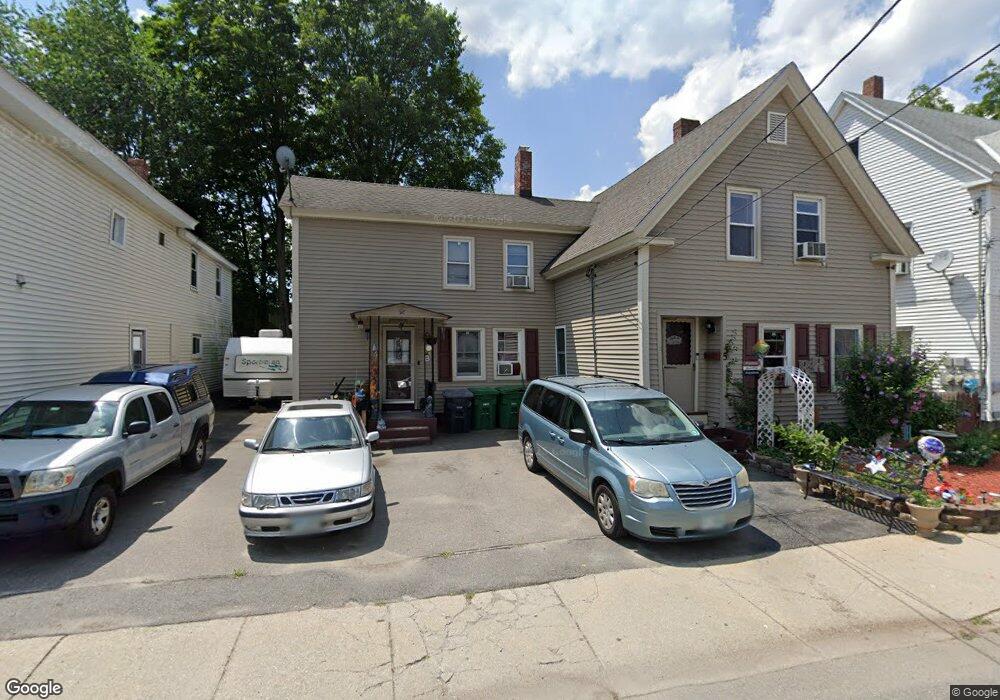
5 Mason St Nashua, NH 03060
Downtown Nashua NeighborhoodEstimated Value: $491,891 - $639,000
6
Beds
2
Baths
2,235
Sq Ft
$247/Sq Ft
Est. Value
About This Home
This home is located at 5 Mason St, Nashua, NH 03060 and is currently estimated at $551,473, approximately $246 per square foot. 5 Mason St is a home located in Hillsborough County with nearby schools including Amherst Street School, Pennichuck Middle School, and Nashua High School North.
Ownership History
Date
Name
Owned For
Owner Type
Purchase Details
Closed on
Apr 30, 2019
Sold by
Reczko Ret and Reczko
Bought by
Reczko Jesse M and Reczko Marne D
Current Estimated Value
Home Financials for this Owner
Home Financials are based on the most recent Mortgage that was taken out on this home.
Original Mortgage
$282,955
Outstanding Balance
$248,262
Interest Rate
4.2%
Mortgage Type
New Conventional
Estimated Equity
$303,211
Purchase Details
Closed on
Oct 25, 1976
Bought by
Reczko Ret
Create a Home Valuation Report for This Property
The Home Valuation Report is an in-depth analysis detailing your home's value as well as a comparison with similar homes in the area
Home Values in the Area
Average Home Value in this Area
Purchase History
| Date | Buyer | Sale Price | Title Company |
|---|---|---|---|
| Reczko Jesse M | $277,000 | -- | |
| Reczko Ret | -- | -- |
Source: Public Records
Mortgage History
| Date | Status | Borrower | Loan Amount |
|---|---|---|---|
| Open | Reczko Jesse M | $282,955 |
Source: Public Records
Tax History Compared to Growth
Tax History
| Year | Tax Paid | Tax Assessment Tax Assessment Total Assessment is a certain percentage of the fair market value that is determined by local assessors to be the total taxable value of land and additions on the property. | Land | Improvement |
|---|---|---|---|---|
| 2024 | $7,905 | $497,200 | $125,200 | $372,000 |
| 2023 | $7,693 | $422,000 | $100,100 | $321,900 |
| 2022 | $7,626 | $422,000 | $100,100 | $321,900 |
| 2021 | $6,137 | $264,300 | $63,400 | $200,900 |
| 2020 | $2,910 | $264,300 | $63,400 | $200,900 |
| 2019 | $5,781 | $264,300 | $63,400 | $200,900 |
| 2018 | $5,606 | $264,300 | $63,400 | $200,900 |
| 2017 | $4,387 | $170,100 | $59,200 | $110,900 |
| 2016 | $4,264 | $170,100 | $59,200 | $110,900 |
| 2015 | $4,173 | $170,100 | $59,200 | $110,900 |
| 2014 | $4,091 | $170,100 | $59,200 | $110,900 |
Source: Public Records
Map
Nearby Homes