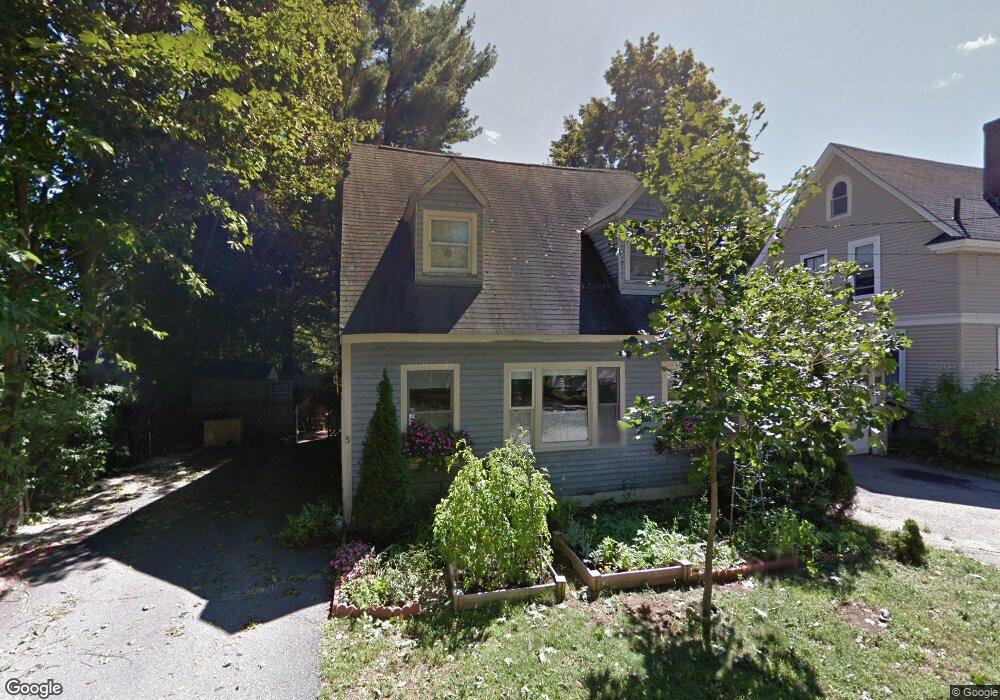
5 Matthew St Concord, NH 03301
South End NeighborhoodEstimated Value: $418,138 - $499,000
3
Beds
1
Bath
1,404
Sq Ft
$331/Sq Ft
Est. Value
About This Home
This home is located at 5 Matthew St, Concord, NH 03301 and is currently estimated at $464,785, approximately $331 per square foot. 5 Matthew St is a home located in Merrimack County with nearby schools including Abbot-Downing School, Rundlett Middle School, and Concord High School.
Ownership History
Date
Name
Owned For
Owner Type
Purchase Details
Closed on
Jul 6, 1999
Sold by
Main Stephen F and Main Andrea S
Bought by
Shore Mary S
Current Estimated Value
Home Financials for this Owner
Home Financials are based on the most recent Mortgage that was taken out on this home.
Original Mortgage
$97,444
Interest Rate
7.19%
Mortgage Type
Purchase Money Mortgage
Create a Home Valuation Report for This Property
The Home Valuation Report is an in-depth analysis detailing your home's value as well as a comparison with similar homes in the area
Home Values in the Area
Average Home Value in this Area
Purchase History
| Date | Buyer | Sale Price | Title Company |
|---|---|---|---|
| Shore Mary S | $97,500 | -- |
Source: Public Records
Mortgage History
| Date | Status | Borrower | Loan Amount |
|---|---|---|---|
| Open | Shore Mary S | $113,000 | |
| Closed | Shore Mary S | $97,444 |
Source: Public Records
Tax History Compared to Growth
Tax History
| Year | Tax Paid | Tax Assessment Tax Assessment Total Assessment is a certain percentage of the fair market value that is determined by local assessors to be the total taxable value of land and additions on the property. | Land | Improvement |
|---|---|---|---|---|
| 2024 | $7,307 | $263,900 | $113,400 | $150,500 |
| 2023 | $7,088 | $263,900 | $113,400 | $150,500 |
| 2022 | $6,832 | $263,900 | $113,400 | $150,500 |
| 2021 | $6,551 | $260,800 | $113,400 | $147,400 |
| 2020 | $6,345 | $237,100 | $99,400 | $137,700 |
| 2019 | $5,906 | $212,600 | $99,400 | $113,200 |
| 2018 | $11,155 | $208,700 | $102,700 | $106,000 |
| 2017 | $5,733 | $203,000 | $100,900 | $102,100 |
| 2016 | $5,390 | $194,800 | $100,900 | $93,900 |
| 2015 | $5,219 | $187,500 | $94,600 | $92,900 |
| 2014 | $5,027 | $187,500 | $94,600 | $92,900 |
| 2013 | -- | $184,800 | $94,600 | $90,200 |
| 2012 | -- | $194,800 | $103,500 | $91,300 |
Source: Public Records
Map
Nearby Homes