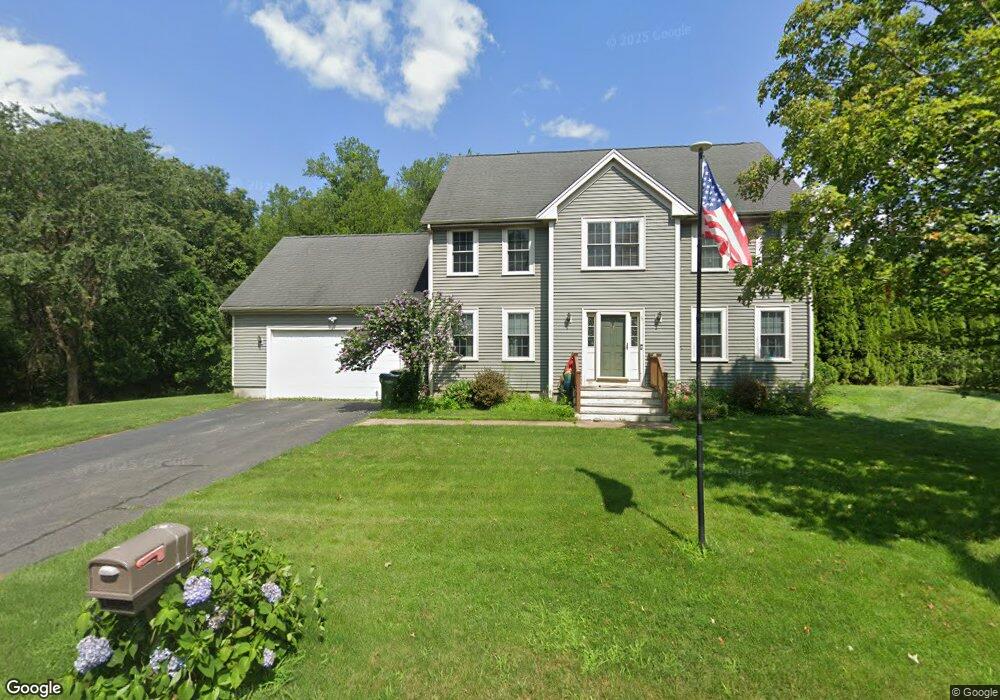
5 Medberry Ln Rehoboth, MA 02769
Estimated Value: $675,807 - $876,000
3
Beds
3
Baths
2,190
Sq Ft
$355/Sq Ft
Est. Value
About This Home
This home is located at 5 Medberry Ln, Rehoboth, MA 02769 and is currently estimated at $776,452, approximately $354 per square foot. 5 Medberry Ln is a home located in Bristol County with nearby schools including Dighton-Rehoboth Regional High School.
Ownership History
Date
Name
Owned For
Owner Type
Purchase Details
Closed on
Jul 11, 2003
Sold by
Mack James
Bought by
Araujo Jaimi L and Araujo Rui J
Current Estimated Value
Home Financials for this Owner
Home Financials are based on the most recent Mortgage that was taken out on this home.
Original Mortgage
$229,900
Outstanding Balance
$97,441
Interest Rate
5.45%
Mortgage Type
Purchase Money Mortgage
Estimated Equity
$679,011
Create a Home Valuation Report for This Property
The Home Valuation Report is an in-depth analysis detailing your home's value as well as a comparison with similar homes in the area
Home Values in the Area
Average Home Value in this Area
Purchase History
| Date | Buyer | Sale Price | Title Company |
|---|---|---|---|
| Araujo Jaimi L | $389,900 | -- |
Source: Public Records
Mortgage History
| Date | Status | Borrower | Loan Amount |
|---|---|---|---|
| Open | Araujo Jaimi L | $229,900 |
Source: Public Records
Tax History Compared to Growth
Tax History
| Year | Tax Paid | Tax Assessment Tax Assessment Total Assessment is a certain percentage of the fair market value that is determined by local assessors to be the total taxable value of land and additions on the property. | Land | Improvement |
|---|---|---|---|---|
| 2025 | $64 | $575,800 | $155,800 | $420,000 |
| 2024 | $6,790 | $597,700 | $186,900 | $410,800 |
| 2023 | $6,310 | $544,900 | $183,000 | $361,900 |
| 2022 | $6,013 | $474,600 | $167,800 | $306,800 |
| 2021 | $3,487 | $441,300 | $152,800 | $288,500 |
| 2020 | $5,886 | $448,600 | $160,100 | $288,500 |
| 2018 | $0 | $424,100 | $152,400 | $271,700 |
| 2017 | $2,580 | $408,800 | $169,500 | $239,300 |
| 2016 | $5,059 | $416,400 | $177,100 | $239,300 |
| 2015 | $4,705 | $382,200 | $168,900 | $213,300 |
| 2014 | $4,651 | $373,900 | $160,600 | $213,300 |
Source: Public Records
Map
Nearby Homes
- 16 Martin St
- 283 Plain St
- 16 Ashlynn Way
- 47 Spring St
- 49 Sophia Dr
- 50 Sophia Dr
- 51 Sophia Dr
- 75 Martin St
- 7 Johnnies Way
- 3 Johnnies Way
- 129 Cameron Way
- 3b Johnnies Way
- 3a Johnnies Way
- 92 Martin St
- 36 Columbine Rd
- 120 Plain St
- 850 Hortonville Rd
- 383 Vinnicum Rd
- 14 Deborah Ann Dr Unit 41
- 490 Dillon Ln