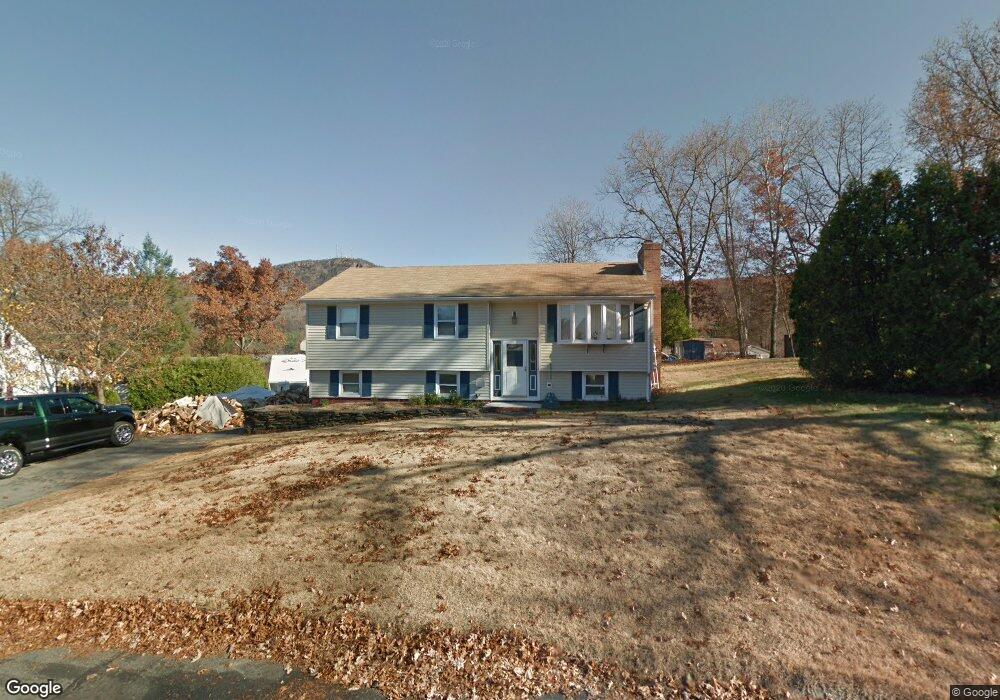
5 Melinda Ln Easthampton, MA 01027
Estimated Value: $399,000 - $461,000
3
Beds
2
Baths
1,586
Sq Ft
$268/Sq Ft
Est. Value
About This Home
This home is located at 5 Melinda Ln, Easthampton, MA 01027 and is currently estimated at $424,644, approximately $267 per square foot. 5 Melinda Ln is a home located in Hampshire County with nearby schools including Easthampton High School, Calvary Baptist Christian School, and Tri-County Schools.
Ownership History
Date
Name
Owned For
Owner Type
Purchase Details
Closed on
Sep 26, 1997
Sold by
Kosla Leona B and Kosla Walter G
Bought by
Carter Donna M and Carter Scott
Current Estimated Value
Home Financials for this Owner
Home Financials are based on the most recent Mortgage that was taken out on this home.
Original Mortgage
$109,250
Outstanding Balance
$17,583
Interest Rate
7.47%
Mortgage Type
Purchase Money Mortgage
Estimated Equity
$407,061
Create a Home Valuation Report for This Property
The Home Valuation Report is an in-depth analysis detailing your home's value as well as a comparison with similar homes in the area
Home Values in the Area
Average Home Value in this Area
Purchase History
| Date | Buyer | Sale Price | Title Company |
|---|---|---|---|
| Carter Donna M | $115,000 | -- |
Source: Public Records
Mortgage History
| Date | Status | Borrower | Loan Amount |
|---|---|---|---|
| Open | Carter Donna M | $109,250 | |
| Previous Owner | Carter Donna M | $15,000 |
Source: Public Records
Tax History Compared to Growth
Tax History
| Year | Tax Paid | Tax Assessment Tax Assessment Total Assessment is a certain percentage of the fair market value that is determined by local assessors to be the total taxable value of land and additions on the property. | Land | Improvement |
|---|---|---|---|---|
| 2025 | $4,901 | $358,500 | $120,200 | $238,300 |
| 2024 | $4,727 | $348,600 | $116,700 | $231,900 |
| 2023 | $3,595 | $245,400 | $91,700 | $153,700 |
| 2022 | $4,056 | $245,400 | $91,700 | $153,700 |
| 2021 | $4,445 | $253,400 | $91,700 | $161,700 |
| 2020 | $4,358 | $245,400 | $91,700 | $153,700 |
| 2019 | $3,812 | $246,600 | $91,700 | $154,900 |
| 2018 | $3,790 | $236,900 | $86,500 | $150,400 |
| 2017 | $3,706 | $228,600 | $83,200 | $145,400 |
| 2016 | $3,564 | $228,600 | $83,200 | $145,400 |
| 2015 | $3,463 | $228,600 | $83,200 | $145,400 |
Source: Public Records
Map
Nearby Homes