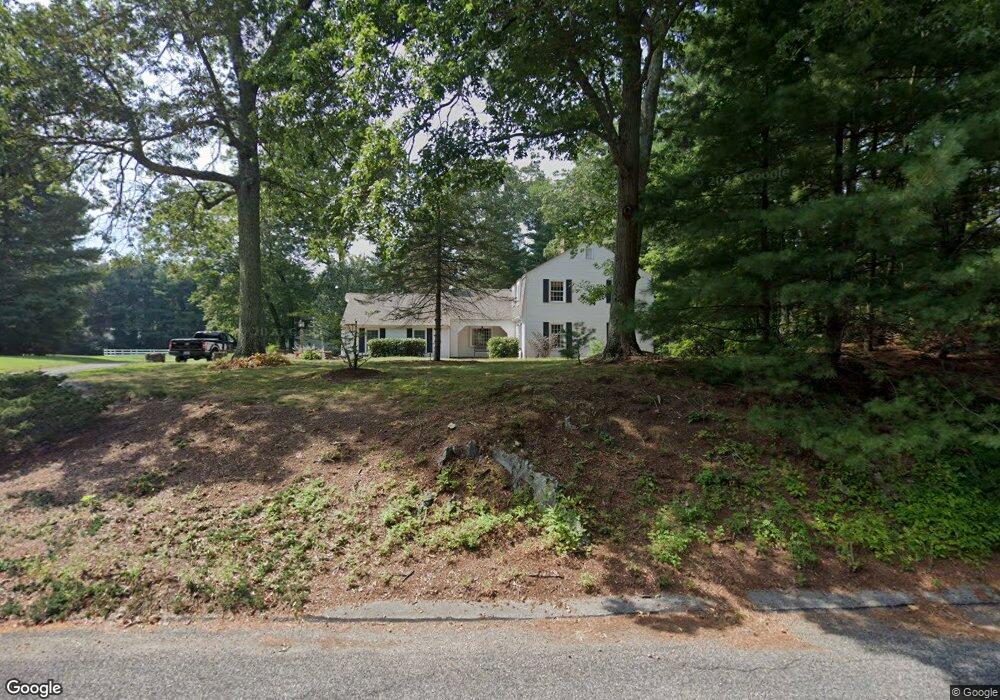
5 Mercer Ln Franklin, MA 02038
Wadsworth NeighborhoodEstimated Value: $897,000 - $1,007,000
4
Beds
3
Baths
2,691
Sq Ft
$357/Sq Ft
Est. Value
About This Home
This home is located at 5 Mercer Ln, Franklin, MA 02038 and is currently estimated at $959,432, approximately $356 per square foot. 5 Mercer Ln is a home located in Norfolk County with nearby schools including Jefferson Elementary School, Remington Middle School, and Franklin High School.
Ownership History
Date
Name
Owned For
Owner Type
Purchase Details
Closed on
Mar 26, 1990
Sold by
Mercer Raymond D
Bought by
Padula Francis N
Current Estimated Value
Create a Home Valuation Report for This Property
The Home Valuation Report is an in-depth analysis detailing your home's value as well as a comparison with similar homes in the area
Home Values in the Area
Average Home Value in this Area
Purchase History
| Date | Buyer | Sale Price | Title Company |
|---|---|---|---|
| Padula Francis N | $188,000 | -- |
Source: Public Records
Mortgage History
| Date | Status | Borrower | Loan Amount |
|---|---|---|---|
| Open | Padula Francis N | $358,000 | |
| Closed | Padula Francis N | $275,000 | |
| Closed | Padula Francis N | $200,000 |
Source: Public Records
Tax History Compared to Growth
Tax History
| Year | Tax Paid | Tax Assessment Tax Assessment Total Assessment is a certain percentage of the fair market value that is determined by local assessors to be the total taxable value of land and additions on the property. | Land | Improvement |
|---|---|---|---|---|
| 2025 | $10,450 | $899,300 | $492,300 | $407,000 |
| 2024 | $10,603 | $899,300 | $492,300 | $407,000 |
| 2023 | $10,419 | $828,200 | $456,800 | $371,400 |
| 2022 | $10,154 | $722,700 | $393,800 | $328,900 |
| 2021 | $9,440 | $644,400 | $377,800 | $266,600 |
| 2020 | $9,224 | $635,700 | $381,600 | $254,100 |
| 2019 | $9,264 | $631,900 | $377,800 | $254,100 |
| 2018 | $8,835 | $603,100 | $373,900 | $229,200 |
| 2017 | $8,961 | $614,600 | $385,400 | $229,200 |
| 2016 | $8,671 | $598,000 | $395,100 | $202,900 |
| 2015 | $8,667 | $584,000 | $381,100 | $202,900 |
| 2014 | $7,984 | $552,500 | $349,600 | $202,900 |
Source: Public Records
Map
Nearby Homes
- 14 Stanford Rd
- 4 Tobacco Rd
- 9 Jefferson Rd
- 19 Peters Ln
- 55 Blackberry Hill Rd
- 16 Peters Ln
- 241 Prospect St
- 2095 West St
- 5 Wadsworth Farm Rd
- 2 Rhodes Way
- 7 Chris Dr
- 2 Michael Rd
- 236 Williams St
- 40 Hillside Dr
- 352 Lake St
- 295 Lake St
- 71 Oxford Dr
- 20 Bertine St
- 65 Palmetto Dr Unit 65
- 9 Pebble Cir Unit 9