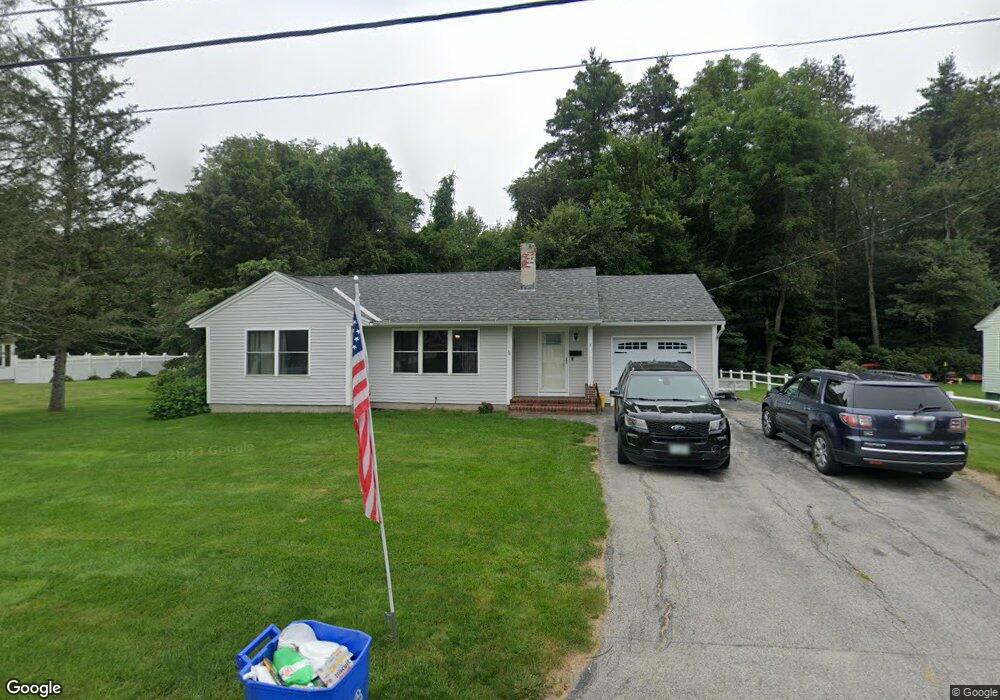
5 Mooreland Ave Concord, NH 03301
South End NeighborhoodEstimated Value: $482,738 - $561,000
3
Beds
2
Baths
1,656
Sq Ft
$324/Sq Ft
Est. Value
About This Home
This home is located at 5 Mooreland Ave, Concord, NH 03301 and is currently estimated at $535,935, approximately $323 per square foot. 5 Mooreland Ave is a home located in Merrimack County with nearby schools including Abbot-Downing School, Rundlett Middle School, and Concord High School.
Ownership History
Date
Name
Owned For
Owner Type
Purchase Details
Closed on
Aug 19, 2016
Sold by
Melbourne Mooreland Rl
Bought by
Moore Marc A and Moore Amy E
Current Estimated Value
Home Financials for this Owner
Home Financials are based on the most recent Mortgage that was taken out on this home.
Original Mortgage
$275,793
Outstanding Balance
$219,552
Interest Rate
3.41%
Mortgage Type
FHA
Estimated Equity
$316,383
Purchase Details
Closed on
May 4, 1998
Sold by
Nixon Tina Jean
Bought by
Melbourne Mooreland Rl
Home Financials for this Owner
Home Financials are based on the most recent Mortgage that was taken out on this home.
Original Mortgage
$45,000
Interest Rate
7.04%
Mortgage Type
Purchase Money Mortgage
Create a Home Valuation Report for This Property
The Home Valuation Report is an in-depth analysis detailing your home's value as well as a comparison with similar homes in the area
Home Values in the Area
Average Home Value in this Area
Purchase History
| Date | Buyer | Sale Price | Title Company |
|---|---|---|---|
| Moore Marc A | $232,000 | -- | |
| Melbourne Mooreland Rl | $127,000 | -- |
Source: Public Records
Mortgage History
| Date | Status | Borrower | Loan Amount |
|---|---|---|---|
| Open | Moore Marc A | $275,793 | |
| Previous Owner | Melbourne Mooreland Rl | $45,000 |
Source: Public Records
Tax History Compared to Growth
Tax History
| Year | Tax Paid | Tax Assessment Tax Assessment Total Assessment is a certain percentage of the fair market value that is determined by local assessors to be the total taxable value of land and additions on the property. | Land | Improvement |
|---|---|---|---|---|
| 2024 | $9,575 | $345,800 | $124,400 | $221,400 |
| 2023 | $9,288 | $345,800 | $124,400 | $221,400 |
| 2022 | $8,953 | $345,800 | $124,400 | $221,400 |
| 2021 | $8,689 | $345,900 | $124,500 | $221,400 |
| 2020 | $8,261 | $308,700 | $98,000 | $210,700 |
| 2019 | $8,023 | $288,800 | $101,900 | $186,900 |
| 2018 | $7,721 | $273,900 | $102,200 | $171,700 |
| 2017 | $7,416 | $262,600 | $102,200 | $160,400 |
| 2016 | $6,342 | $229,200 | $100,300 | $128,900 |
| 2015 | $5,938 | $217,200 | $108,800 | $108,400 |
| 2014 | $5,823 | $217,200 | $108,800 | $108,400 |
| 2013 | $5,482 | $214,300 | $108,800 | $105,500 |
| 2012 | $5,188 | $212,900 | $114,500 | $98,400 |
Source: Public Records
Map
Nearby Homes