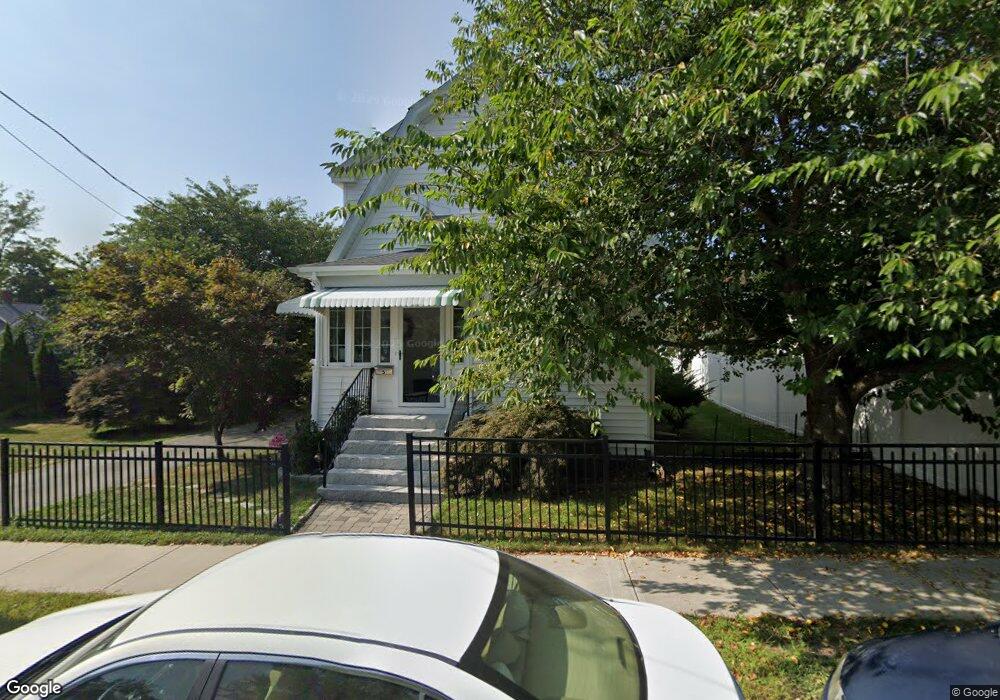
5 Morgan Rd Quincy, MA 02170
Quincy Center NeighborhoodEstimated Value: $645,000 - $724,304
3
Beds
2
Baths
1,392
Sq Ft
$494/Sq Ft
Est. Value
About This Home
This home is located at 5 Morgan Rd, Quincy, MA 02170 and is currently estimated at $687,826, approximately $494 per square foot. 5 Morgan Rd is a home located in Norfolk County with nearby schools including Charles A. Bernazzani Elementary School, Central Middle School, and North Quincy High School.
Ownership History
Date
Name
Owned For
Owner Type
Purchase Details
Closed on
Oct 7, 1998
Sold by
Green Gerald R Est
Bought by
Nguy Binh I
Current Estimated Value
Home Financials for this Owner
Home Financials are based on the most recent Mortgage that was taken out on this home.
Original Mortgage
$131,200
Outstanding Balance
$28,775
Interest Rate
6.92%
Mortgage Type
Purchase Money Mortgage
Estimated Equity
$659,051
Create a Home Valuation Report for This Property
The Home Valuation Report is an in-depth analysis detailing your home's value as well as a comparison with similar homes in the area
Home Values in the Area
Average Home Value in this Area
Purchase History
| Date | Buyer | Sale Price | Title Company |
|---|---|---|---|
| Nguy Binh I | $164,000 | -- |
Source: Public Records
Mortgage History
| Date | Status | Borrower | Loan Amount |
|---|---|---|---|
| Open | Nguy Binh I | $131,200 |
Source: Public Records
Tax History
| Year | Tax Paid | Tax Assessment Tax Assessment Total Assessment is a certain percentage of the fair market value that is determined by local assessors to be the total taxable value of land and additions on the property. | Land | Improvement |
|---|---|---|---|---|
| 2025 | $7,560 | $655,700 | $380,900 | $274,800 |
| 2024 | $7,328 | $650,200 | $380,900 | $269,300 |
| 2023 | $6,828 | $613,500 | $362,800 | $250,700 |
| 2022 | $6,238 | $520,700 | $290,200 | $230,500 |
| 2021 | $6,219 | $512,300 | $290,200 | $222,100 |
| 2020 | $6,112 | $491,700 | $290,200 | $201,500 |
| 2019 | $5,666 | $451,500 | $271,200 | $180,300 |
| 2018 | $5,513 | $413,300 | $246,600 | $166,700 |
| 2017 | $5,633 | $397,500 | $246,600 | $150,900 |
| 2016 | $5,254 | $365,900 | $224,200 | $141,700 |
| 2015 | $4,871 | $333,600 | $203,800 | $129,800 |
| 2014 | $4,694 | $315,900 | $194,100 | $121,800 |
Source: Public Records
Map
Nearby Homes
- 72 Oakland Ave
- 10 Presidents Ln Unit 10
- 1025 Hancock St Unit 6J
- 1025 Hancock St Unit 2K
- 22 Newton Ave
- 20 Whitney Rd Unit 1
- 20 Whitney Rd Unit 6
- 20 Whitney Rd Unit 2
- 28 Edgewood Cir
- 144 Kemper St
- 195 Thomas Burgin Pkwy Unit 212
- 1 Cityview Ln Unit 506
- 1 Cityview Ln Unit 709
- 1 Cityview Ln Unit 707
- 59 Spear St Unit 201
- 59 Spear St Unit 302
- 59 Spear St Unit 402
- 59 Spear St Unit 202
- 59 Spear St Unit 301
- 59 Packards Ln Unit 5
Your Personal Tour Guide
Ask me questions while you tour the home.