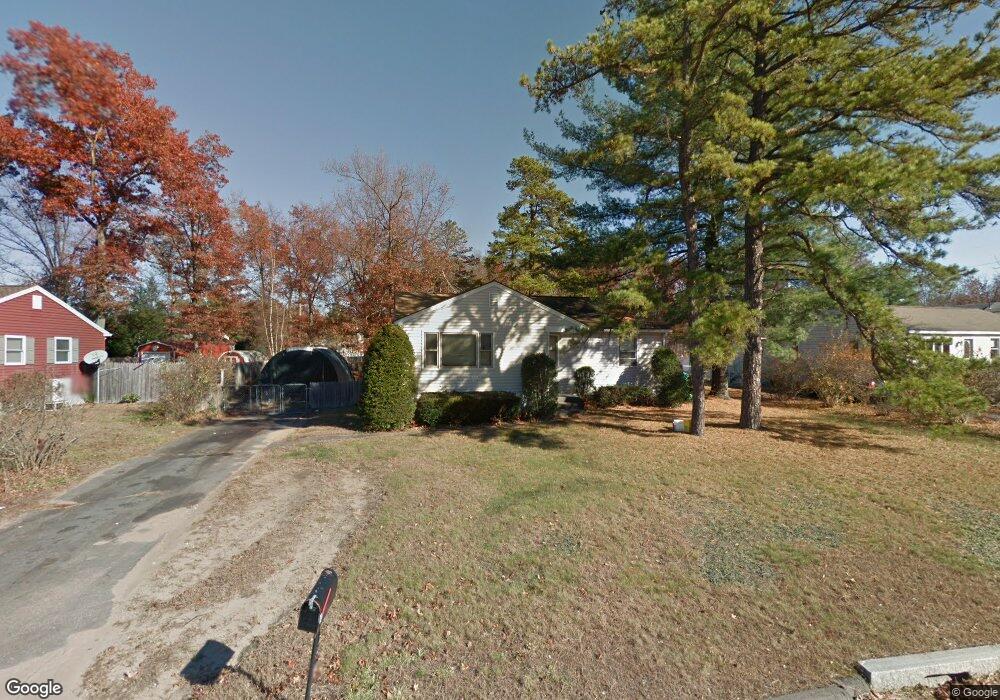
5 Morin Dr Easthampton, MA 01027
Estimated Value: $333,620 - $351,000
3
Beds
2
Baths
966
Sq Ft
$357/Sq Ft
Est. Value
About This Home
This home is located at 5 Morin Dr, Easthampton, MA 01027 and is currently estimated at $344,405, approximately $356 per square foot. 5 Morin Dr is a home located in Hampshire County with nearby schools including Easthampton High School, Calvary Baptist Christian School, and Westfield Christian Academy.
Ownership History
Date
Name
Owned For
Owner Type
Purchase Details
Closed on
Sep 12, 2025
Sold by
Adams Charles and Us Bank Tna Tr
Bought by
Rcaf Acquisiion T and Us Bank Tna Tr
Current Estimated Value
Purchase Details
Closed on
Sep 25, 1992
Sold by
Cabana Jennifer L and Cabana Jeffrey A
Bought by
Adams Brenda M and Adams Charles
Purchase Details
Closed on
Aug 2, 1989
Sold by
Poudrier Edward
Bought by
Lavallee Chrles R
Create a Home Valuation Report for This Property
The Home Valuation Report is an in-depth analysis detailing your home's value as well as a comparison with similar homes in the area
Home Values in the Area
Average Home Value in this Area
Purchase History
| Date | Buyer | Sale Price | Title Company |
|---|---|---|---|
| Rcaf Acquisiion T | $273,766 | -- | |
| Adams Brenda M | $95,500 | -- | |
| Lavallee Chrles R | $75,000 | -- |
Source: Public Records
Mortgage History
| Date | Status | Borrower | Loan Amount |
|---|---|---|---|
| Previous Owner | Lavallee Chrles R | $132,000 | |
| Previous Owner | Lavallee Chrles R | $93,691 | |
| Previous Owner | Lavallee Chrles R | $102,695 |
Source: Public Records
Tax History Compared to Growth
Tax History
| Year | Tax Paid | Tax Assessment Tax Assessment Total Assessment is a certain percentage of the fair market value that is determined by local assessors to be the total taxable value of land and additions on the property. | Land | Improvement |
|---|---|---|---|---|
| 2025 | $3,817 | $279,200 | $118,300 | $160,900 |
| 2024 | $3,682 | $271,500 | $114,800 | $156,700 |
| 2023 | $2,822 | $192,600 | $90,500 | $102,100 |
| 2022 | $3,184 | $192,600 | $90,500 | $102,100 |
| 2021 | $3,471 | $197,900 | $90,500 | $107,400 |
| 2020 | $3,421 | $192,600 | $90,500 | $102,100 |
| 2019 | $2,880 | $186,300 | $90,500 | $95,800 |
| 2018 | $2,765 | $172,800 | $85,400 | $87,400 |
| 2017 | $2,697 | $166,400 | $82,100 | $84,300 |
| 2016 | $2,781 | $178,400 | $82,100 | $96,300 |
| 2015 | $2,703 | $178,400 | $82,100 | $96,300 |
Source: Public Records
Map
Nearby Homes